Simulating Poisson random variables with large means

There’s basically only one method for simulating Poisson variables with a small parameter value. This direct method, as I call it, uses the inter-arrival times of a homogeneous Poisson (stochastic) process, which I covered in a previous post.

But if large parameter, which coincides with its mean, is large, then this method becomes too slow, so you need to use other methods.  In another post, I briefly surveyed these methods and listed different language libraries that use them, ranging from open source projects NumPy and R to industry-level libraries MLK (by Intel) and cuRand (CUDA) by Nvidia.

To simulate large-mean Poisson random variables, I coded up in Python and MATLAB (for now) two of these methods from the two respective papers:

  • 1979, Atkinson, The computer generation of Poisson random variables;
  • 1993, Hörmann, The transformed rejection method for generating Poisson random variable.

You can find my code here.

Again, the code I wrote is only suitable for large parameter values, where the meaning of large depends on the procedure being used, but it’s typically around 30. Consequently, any code for generating Poisson variables should have an if-statement, using the direct method for small parameter values and another method, such as the ones above, for large parameter values.

Update: In another post I presented these two algorithms in C. You can find my code here.

Algorithms

I’ll give some light details of the two methods, which are referred to as PA and PTRS algorithms in the respective papers. I suggest reading the papers for further details.

Both algorithms are (acceptance-)rejection methods. I discuss this general method, first proposed by Neumann, in another post. In context of generating Poisson variables, these methods are, according to the book by Devroye (page 502), known for being relatively simple to implement and fast to execute.

Both algorithms require calculating the log of a factorial or, equivalently, a log of a gamma function, which is done by using approximations, such those of Stirling or Lanczos. This is a common approach in general, as you’ll find that computer functions, such as those in MATLAB or Python (NumPy), that give values for gamma functions and their logs are always based on approximations of the gamma function.  That means you can write your approximation for the log of a factorial or use a pre-existing function.

Algorithm PA  by Atkinson (1979)

The Algorithm PA proposed by Atkinson, among other methods, is a rejection method that uses a logistic distribution as the envelope distribution. (Often such algorithms use a normal distribution as the envelop distribution.)

After writing my code, I noticed that John D. Cook gave pseudo-code of the method in this post and then presented an implementation in C# in this post. Apart from that, I have not seen any implementations of this method.

Algorithm PTRS by Hörmann (1993)

Hörmann refers to the Algorithm PTRS method as a transformed rejection method. It uses the inverse method, which I covered in a previous post, and a rejection method.

I have only seen one implementation of this algorithm. It’s written in C for the Python library NumPy; see the code here.  You’ll notice my code and that C code is very similar, modulus some logarithm identities.

Possible (small) error: I noticed that in that C code, on line 591, the implementation of step 2.0 of the PTRS Algorithm has a strictly less than condition, so it’s \(k <0\), whereas in the original paper (and hence my code),  the condition is \(k\leq 0\). Perhaps this possible error is insignificant, as the procedure is for large-valued Poisson random variables, so the \(k=0\) scenario rarely happens.

Code

I only present here the code in Python, but you can go here to see the code implemented in MATLAB. I also wrote a script that tests if the generated variates (or simulated values) adhere to a Poisson distribution. This test compares the mean and variance (the ratio of which should be equal to one) and a chi-squared test.

Warning: My Python and MATLAB code is only for illustration purposes. In Python (with SciPy), MATLAB, or similar, you would use the pre-existing functions for simulating Poisson random variables.

Algorithm PA  by Atkinson (1979)

# This code generates Poisson variates (or simulates Poisson variables).
# using a method designed for large (>30) Poisson parameter values.
#
# The generation method is Algorithm PA, a type of rejection method, from 
# the paper:
#
# 1979 - Atkinson - "The Computer Generation of Poisson Random Variables"
#
# In practice, you should *always* use the built-in NumPy function
# random.poisson, which (for large Poisson parameter) uses Algorithm PTRS in the
# paper:
#
# 1993 - Hörmann - "The transformed rejection method for generating Poisson
# random variables"
#
# That method is also suggested by Knuth in Volume 2 of his classic
# series "The Art of Computer Programming".
#
# INPUT:
# mu is a single Poisson parameter (or mean) such that mu>=0.
# OUTPUT:
# result_k is a single Poisson variate (that is, an instance of a Poisson random
# variable), which is a non-negative integer.
#
# Author: H. Paul Keeler, 2019.
# Website: hpaulkeeler.com
# Repository: github.com/hpaulkeeler/posts

import numpy as np;  # NumPy package for arrays, random number generation, etc
import scipy 
from getLogFac import getLogFac # type: ignore

def funPoissonLargePA(mu):
    #precalculate some Poisson-parameter-dependent numbers
    c = 0.767 - 3.36/mu;
    beta = np.pi/np.sqrt(3.0*mu);
    alpha = beta*mu;
    k = np.log(c) - mu - np.log(beta);
    log_mu=np.log(mu);

    result_n=-1; #initialize the Poisson random variable (or variate)
    while (result_n<0):
        U = np.random.uniform(0, 1, 1); #generate first uniform variable
        x = (alpha - np.log((1.0 - U)/U))/beta;

        if (x <-.5):
            continue
        else:
            V = np.random.uniform(0, 1, 1); #generate second uniform variable
            n = np.floor(x+.5);
            y = alpha - beta*x;
            #logfac_n=getLogFac(n); 
            #above can be replaced with scipy function: 
            logfac_n=scipy.special.gammaln(n+1)

            #two sides of an inequality condition
            lhs = y + np.log(V/(1.0 + np.exp(y))**2);
            rhs = k + n*log_mu- logfac_n; # NOTE: uses log factorial n

            if (lhs <= rhs):
                result_n=n;
                return result_n;
            else:
                continue;

            #end if-statement

        #end if-statement
    #end while-loop

#end function

Algorithm PTRS by Hörmann (1993)

# This code generates Poisson variates (or simulates Poisson variables).
# using a method designed for large (>10) Poisson parameter values.
#
# The generation method is Algorthm PTRS, a type of rejection method, from
# the paper:
#
# 1993 - Hörmann - "The transformed rejection method for generating Poisson
# random variables"
#
# WARNING: This code is for illustration purposes only.
#
# In practice, you should *always* use the built-in NumPy function
# random.poisson, which (for large Poisson parameter) uses Algorithm PTRS in the
# above paper.
#
# INPUT:
# mu is a single Poisson parameter (or mean) such that mu>=0.
# OUTPUT:
# result_k is a single Poisson variate (that is, an instance of a Poisson random
# variable), which is a non-negative integer.
#
# Author: H. Paul Keeler, 2019.
# Website: hpaulkeeler.com
# Repository: github.com/hpaulkeeler/posts

import numpy as np;  # NumPy package for arrays, random number generation, etc
import scipy 
from getLogFac import getLogFac # type: ignore

def funPoissonLargePTRS(mu):
    #precalculate some Poisson-parameter-dependent numbers
    b = 0.931 + 2.53 * np.sqrt(mu);
    a =  -0.059 + 0.02483 * b;
    vr = 0.9277 - 3.6224 / (b - 2);
    one_over_alpha=1.1239 + 1.1328/(b - 3.4);

    result_n=-1; #initialize the Poisson random variable (or variate)
    #Steps 1 to 3.1 in Algorithm PTRS
    while (result_n<0):
        #generate two uniform variables
        U = np.random.uniform(0, 1, 1); 
        V = np.random.uniform(0, 1, 1); 

        U=U-0.5;
        us = 0.5 -  abs(U);

        n=np.floor((2 * a / us + b) * U + mu + 0.43);

        if (us>=0.07)&(V<=vr):
            result_n = n;
            return result_n;
        #end if-statement

        if (n<=0) |((us < 0.013) & ( V> us)):
            continue
        #end if-statement

        log_mu = np.log(mu);
        #logfac_n=getLogFac(n); 
        #above can be replaced with SciPy's function: 
        logfac_n = scipy.special.gammaln(n+1);

        #two sides of an inequality condition
        lhs = np.log(V * one_over_alpha / (a/us/us + b));
        rhs = -mu + n * log_mu - logfac_n ;# NOTE: uses log factorial n

        if lhs <= rhs:
            result_n = n;
            return result_n;
        else:
            continue
        #end if-statement


    #end while-loop

#end function

Further reading

Algorithm PA was proposed in the paper:

  • 1979, Atkinson, The computer generation of Poisson random variables.

This algorithm is also given in the book Monte Carlo Statistical Methods by Casella and Robert; see Algorithm A.6.

Algorithm PTRS was proposed in the paper:

  • 1993, Hörmann, The transformed rejection method for generating Poisson random variable.

Simulating Matérn hard-core point processes

If you wanted to create a point process with repulsion, a reasonable first attempt would be to build off a Poisson point process by removing points according to some rule to ensure that no two points were within a certain distance of each other. Using this natural idea, Bertril Matérn proposed a family of repulsive point processes called Matérn hard-core point processes.

More specifically, Matérn proposed several points processes, including two types of hard-core point processes now called Type I and Type II. (Matérn proposed a third type, called Type III, but it’s considerably harder to simulate on a computer, as detailed in this article.) These types of hard-core point processes are completely different to the Matérn cluster point process.

As I discussed in a previous post, the Poisson point process may not be adequate for representing point phenomena whose points exhibit large degrees of repulsion or clustering. I already covered the Matérn and Thomas cluster point processes, which show distinct clustering in their configurations. In this post, I’ll cover Matérn hard-core point processes. The Type I point processes is the easier of the two, so I’ll start with that one.

Overview

Simulating Matérn hard-core point processes requires first simulating a homogeneous Poisson point process with an intensity \(\lambda>0\) on some simulation window, such as a rectangle, which is the simulation window I will use here. I have already written about simulating the homogeneous Poisson point processes on a rectangle and a disk, so those posts are good starting points.

Given the Poisson point process, the points then need to be thinned in such a manner to ensure that for each point, there is no other point within some fixed \(r>0\) of the point. This distance \(r>0\) is the radius of the hard core of each point.

I have already covered the point process operation of thinning. But it’s important to note here that in this construction a dependent thinning is being applied. (If I just applied an independent thinning, then the resulting point process will be another Poisson point process with no repulsion between points.)

Edge effects

The main trick behind sampling this point process is that it’s possible for points inside the simulation window to be thinned due to their closeness to points that are located outside the simulation window. In other words, points outside the simulation window can cause points inside the window to be thinned. (I discussed a very similar issue in the posts on the Matérn and Thomas cluster point processes.)

To remove these edge effects, the underlying Poisson point process must be simulated on an extended version of the simulation window. The points are then thinned according to a dependent thinning, which is covered in the next section. Then only the retained points inside the simulation window are kept and the remaining points are ignored. Consequently, the underling Poisson points are simulated on an extended window, but we only see the final points inside the simulation window.

To create the extended simulation window, we add a strip of width \(r\) all around the simulation window. Why? Well, the distance \(r\) is the maximum distance from the simulation window that another point (outside the simulation window) can exist, while still causing points inside the simulation window to be thinned. This means it is impossible for a hypothetical point beyond this distance (outside the extended window) to cause a point inside the simulation window to be thinned.

Dependent thinning rules

Type I

For each point inside the simulation window, check if there are any other points (including those in the extended window) within distance \(r\) of the point. If no, then keep the point. If yes, then remove the point and the points that are within distance \(r\) of the point. The remaining points inside the simulation window form a Matérn Type I point process.

This is a relatively simple thinning rule, which only requires calculating all the inter-point distances. But it is also a very strong thinning rule, meaning that it removes many points. Depending on the Poisson point process intensity \(\lambda\) and core radius \(r\), it is quite possible that all the points are removed, resulting in an empty configuration.

Now we examine the case when the thinning rule is not as strong.

Type II

To create Matérn Type II point process, we assign an independent uniform random variable to each point of the underlying Poisson point process defined on the extended window. In point process terminology, these random variables are called marks, resulting in a marked point process. In the the context of the Matérn Type II point process, these random random marks are usually called ages.

Then for each point in the simulation window, we consider all the points within distance \(r\) of the point. If this point is the youngest (or, equivalently, the oldest) point, then the point is kept. In other words, the point is only kept if its random mark is smaller (or larger) than the random marks of all the other points within distance \(r\) of the point. The remaining points inside the simulation window form a Matérn Type II point process.

Intensity expressions

Using point process and probability theory, one can derive mathematical expressions for the intensities (that is, the average density of points per unit area). These closed-form expressions can then be used to check that the correct number of points are being generated on average over many simulations.

Type I

The intensity of the Type I point process is given by

\[\mu_1=\lambda e^{-\lambda \pi r^2},\]

where \(\lambda \pi r^2\) is simply the area of the core.

Type II

The intensity of the Type II point process is given by

\[\mu_2=\frac{1}{\pi r^2}(1-e^{-\lambda \pi r^2}),\]

which can be written with the intensity of the the Type I point process as

\[\mu_2=\frac{1}{\pi r^2}(1-\frac{\mu_1}{\lambda}).\]

Code

I wrote the sampling code in MATLAB and Python, which are, as usual, very similar to each other. The code, which is is located here, simulates both Type I and II Matérn points processes. It also compares the empirical intensity to the the values given by the mathematical expressions in the previous section.

MATLAB

The MATLAB code is here.

Python

The Python code is here.

Results

I have plotted single realizations of the Matern Type I and II point processes, as well as the underlying Poisson point process in the same window.

MATLAB

Python

Further reading

Matérn hard-core point processes are covered in standard books on the related fields of spatial statistics, point processes and stochastic geometry, such as the following: Spatial Point Patterns: Methodology and Applications with R by Baddeley, Rubak and Turner, on page 140; Statistical Analysis and Modelling of Spatial Point Patterns Statistics by Illian, Penttinen, Stoyan, amd Stoyan, Section 6.5.2, starting on page 388; and; Stochastic Geometry and its Applications by Chiu, Stoyan, Kendall and Mecke, Section 5.4, starting on page 176. The first two books are particularly good for beginners.

The aforementioned book Spatial Point Patterns: Methodology and Applications with R is written by spatial statistics experts Baddeley, Rubak and Turner. It covers the spatial statistics (and point process simulation) R-package spatstat., which has the functions rMaternI and rMaternII for simulating the two point processes respectively.

Simulating Poisson random variables – Survey of methods

In this post I’ll cover the different ways for generating Poisson random variates. (I often just say simulating Poisson variables.) I’ll then list which methods different language libraries use, ranging from open source projects NumPy and R to industry-level libraries MLK (by Intel) and cuRand (CUDA) by Nvidia.

Direct method doesn’t scale well

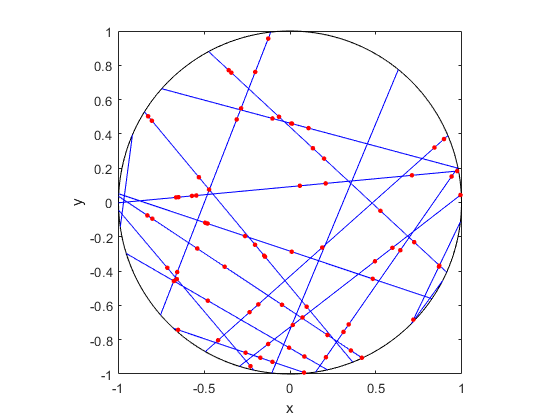
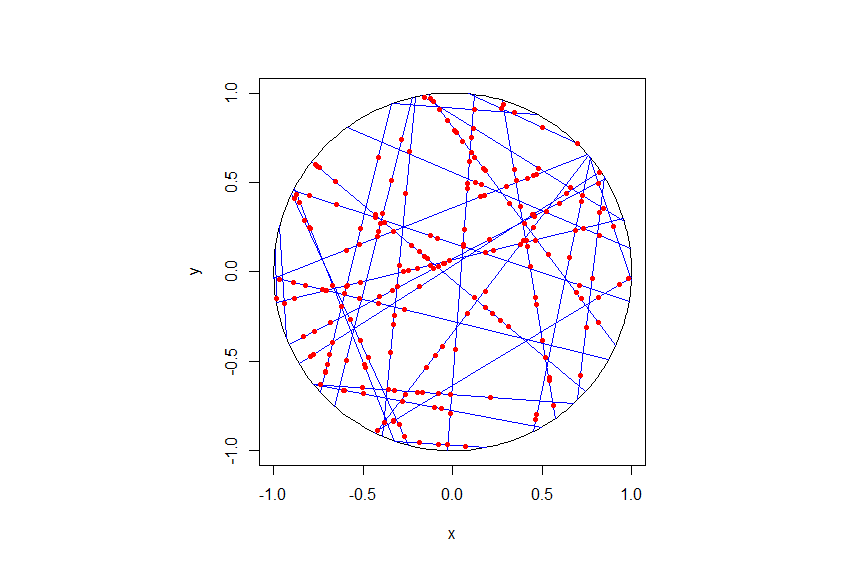
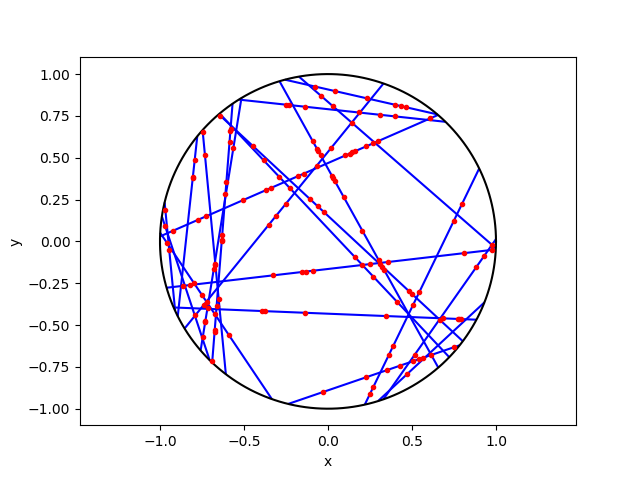
In the previous post, I discussed how to sample or generate Poisson random variables or, more correctly, variates. I detailed a direct method that uses the fact that a Poisson stochastic process, which is directly related to a Poisson point process, has inter-arrival times that form independent and identically distributed exponential variables.

The direct method is an easy and intuitive sampling method, explaining why it is often used. I implemented the method in MATLAB, Python, C and C#, which can be found here. Later, in another post, I implemented the same Poisson sampling method in Fortran, which is located here.)

As elegant and exact as this simulation method is, it unfortunately decreases in speed as the Poisson parameter \(\lambda\) increases. In a tutorial published in 1983, Brian D. Ripely, a major figure in spatial statistics, says this about the direct method:

This is simple, but has expected time proportional to \(\lambda\). Some of its competitors use rejection methods with the envelope distribution that of the integer part of a continuous random variable, such as logistic, Laplace and normal mixed with exponential distributions.

We recall that acceptance-rejection or rejections methods involve simulating a random object, such as a random variable, by first simulating another random object of the same type that is easier to simulate.  The simulation method then accepts or rejects these random objects based on a certain ratio. The distribution of the simpler random object that is first simulated is called the envelope distribution. Such rejection methods are one way to simulate Poisson variables.

In short, when simulating Poisson variables, the appropriate simulation algorithm should be chosen based on the Poisson parameter. Consequently, the code of most computer functions for generating Poisson variables will have an if-statement, using the direct method for small parameter values and another method for large parameter values. In addition to that, the method for large Poisson parameter values should be both fast but simple to implement.

We now consider the other methods.

Different methods

Over the years there have been different methods proposed for producing Poisson random variates. In the book Non-uniform random variate generation, Luc Devroye groups (in Section X.3 on page 502) the different methods into five categories coupled with his views. These methods are:

  1. Direct methods based on the homogeneous Poisson stochastic process having exponential inter-arrival times. These methods are simple, but the expected time is proportional to the Poisson parameter \(\lambda\).
  2. Inversion methods that search through a table of cumulative Poisson probabilities. Examples include the papers by Fishman (1976) and Atkinson (1979)*.
  3. Methods that use the recursive properties of the Poisson distribution. The paper by Ahrens and Dieter (1974) uses this approach, and its expected time of completion is proportional to \(\log\lambda\).
  4. Acceptance-rejection (or rejection) methods that give relatively fast but simple algorithms. Such methods are proposed in the papers by Atkinson (1979)*, Ahrens and Dieter (1980) and Devroye (1981) or the technical report by Schmeiser and Kachitvichyanukul (1981).
  5. Acceptance-complement methods that uses a normal distribution as the starting distribution, such as the paper by Ahrens and Dieter (1982). This method is fast, but the code is rather long.

*Atkinson had (at least) two papers on generating Poisson variates published in 1979, but I believe Devroye is referring to the first paper, because in the second paper Atkinson compares methods proposed by others.

For the paper titles, see the Further reading section below.

Code

In a separate post, I present implementations in Python and MATLAB of algorithms found respectively in the papers by Atkinson (1979) and Hörmann (1991).  But these are only for illustration purposes, as Python (with SciPy) and MATLAB only have good functions for generating Poisson variables.

Methods implemented in popular libraries

I’ll now state which methods are used in various programming languages and numerical methods. I won’t go into the details how the methods work, just citing the papers instead.

MATLAB

For small \(\lambda\) values, the MATLAB function poissrnd uses the  direct method (based on inter-arrival times) with a while-loop.

For \(\lambda\) values greater than fifteen, I believe that the MATLAB function poissrnd uses Algorithm PG from the 1974 paper by Ahrens and Dieter, which uses the the generation of gamma and binomial random variates.

But to come to this conclusion, I had to do some investigating. You can skip to the next section if you’re not interested, but now I’ll explain my reasoning.

The MATLAB documentation says it uses a method proposed by Ahrens and Dieter, but these two researchers developed a number of methods for generating Poisson variables. The MATLAB code cites Volume 2 of the classic series by Knuth, who says the method is due to Ahrens and Dieter, but he doesn’t give an exact citation in that section of the book. Confusingly, Knuth cites in his book a couple papers by Ahrens and Dieter for generating different random variates. (Knuth later cites a seemingly relevant 1980 paper by Ahrens and Dieter, but that details another method.)

Both the MATLAB code and Knuth cite the book by Devroye. In his book (Exercise 3.5.2), Devroye discusses one method, among others, from a 1974 paper by Ahrens and Dieter. Another hint is given by examining the code of the MATLAB function poissrnd, which reveals that it uses the function randg to generate gamma variables. In the Ahrens and Dieter 1974 paper, their Algorithm PG (for producing Poisson variates) uses gamma random variables, and it’s suggested to use a parameter value of \(7/8\). This is the same parameter used in the MATLAB code and mentioned by Knuth, confirming that this is the right paper by Ahrens and Dieter.

In summary, for large \(\lambda\) the function MATLAB uses Algorithm PG from the 1974 paper by Ahrens and Dieter, whereas for small values it uses the direct method, which they refer to as the multiplication method.

R

In R, the function rpois use an algorithm outlined in the 1982 paper by Ahrens and Dieter. You can view the R source code here. The two cases for \(\lambda\) (or \(\mu\) in the paper) depend on whether \(\lambda\) is greater than ten or not. For small \(\lambda\), the R function rpois does not use the method based on inter-arrival times, but rather an inversion method based on a table of (cumulative) probabilities given by the Poisson probability distribution.

Python (NumPy)

In NumPy, the function numpy.random.poisson generates Poisson variates. The source code for the NumPy library is here, but for the Poisson function the underlying code is actually written in C; see the distributions.c file located here. For small Poisson parameter \(\lambda\), the code uses the direct method; see the function random_poisson_mult in the code.

For Poisson parameter \(\lambda \geq 10\), the comments in the code reveal that it uses a method from a 1993 paper by Hörmann; see Algorithm PTRS on page 43 of the paper. This is a transformation method, which for NumPy is implemented in the C code as the function random_poisson_ptrs. The method, which Hörmann calls the transformed rejection with squeeze, combines inversion and rejection methods.

Octave

Octave is intended to be a GNU clone of MATLAB, so you would suspect it uses the same methods as MATLAB for generating Poisson random variates. But the Octave function poissrnd uses different methods. The code reveals it generates the Poisson variates with a function called prand. It considers different cases depending on the value of the Poisson parameter \(\lambda\) as well as whether a single variable (that is, a scalar) or vector or matrix of Poisson variates are being generated.

In total, the Octave function prand uses five different methods. For two of the methods, the documentation cites methods from the classic book Numerical Recipes in C (the 1992 edition); see next section. To generate a single Poisson variate with Poisson parameter \(\lambda \leq 12\), the Octave function prand uses the direct method based on inter-arrival times.

Numerical Recipes (Fortran, C and C++)

The book Numerical Recipes is a classic by Press, Teukolsky, Vetterling and Flannery on numerical methods. The books comes in different editions reflecting different publication years and computer languages. (In the first two editions of the book, the authors implemented the algorithms respectively in Fortran and C.)

For generating Poisson variates, the book contents seems to have not changed over the editions that I looked at, which covered the programming languages Fortran (77 and 90), C, and C++. The authors cover Poisson generation in Section 7.3 in the Fortran and C editions. In the third edition of Numerical Recipes, they implement their methods in C++ in Section 7.3.12.

For small values of Poisson parameter \(\lambda\), Numerical Recipes uses the direct method. For \(\lambda >12\) values, an acceptance-rejection method is used, which relies upon finding a continuous version of the discrete Poisson probability distribution.

GSL Library (C)

In the GSL library, one can use the function gsl_ran_poisson, which uses the the direct method of exponential times. The code, which can be viewed here, cites simply Knuth (presumably the second volume). But it seems to use the aforementioend Algorithm PG (for producing Poisson variates) from the 1974 paper by Ahrens and Dieter 1974; see the section above on MATLAB.

NAG Library (C)

Although I didn’t see the code, it appears that the function nag_rand_poisson (g05tjc ) in the NAG library also uses the direct method, based on the material in the second volume of series by Knuth. But in a 1979 paper Atkinson says that the NAG library uses a method from the 1974 paper by Ahrens and Dieter.

Boost library Random (C++)

The Boost library Random uses the PTRD algorithm proposed in the 1993 paper by Hörmann to generate Poisson variates; see Algorithm PTRD on page 42 of the paper.  In the same paper appears the PTRS method, which is used by Python (NumPy) (though implemented in C), as mentioned above.

MKL library (C)

In the MKL C library written by Intel, there seems to be three methods in use for generating Poisson variates.

The first function is called VSL_RNG_METHOD_POISSON_PTPE, which does the following for a Poisson distribution with parameter \(\Lambda\):

If Λ ≥ 27, random numbers are generated by PTPE method. Otherwise, a combination of inverse transformation and table lookup methods is used. The PTPE method is a variation of the acceptance/rejection method that uses linear (on the fraction close to the distribution mode) and exponential (at the distribution tails) functions as majorizing functions. To avoid time-consuming acceptance/rejection checks, areas with zero probability of rejection are introduced and a squeezing technique is applied.

This function uses the so-called PTPE method, which is outlined in a 1981 technical report by Schmeiser and Kachitvichyanukul.

The second function is called VSL_RNG_METHOD_POISSON_POISNORM, which does the following :

If Λ < 1, the random numbers are generated by combination of inverse transformation and table lookup methods. Otherwise, they are produced through transformation of the normally distributed random numbers.

The third function is called VSL_RNG_METHOD_POISSONV_POISNORM, which does the following:

If Λ < 0.0625, the random numbers are generated by inverse transformation method. Otherwise, they are produced through transformation of normally distributed random numbers.

cuRAND (C)

Finally, there is the  CUDA Random Number Generation library (cuRAND) developed by Nvidia for their (now ubiquitous) graphical processing units (GPUs).   This C/C++ library has a function for generating Poisson variates. To see the C code, copies of it can be found in various GitHub repositories, such as this one. The cuRAND function curand_poisson uses the direct function for Poisson parameter values  less than 64. For parameters values greater than 4000, it uses a normal approximation (rounded to the nearest integer).

For other values, the function curand_poisson uses a rejection method based on an approximation of the incomplete gamma function; see the function curand_poisson_gammainc. The book by Fishman is cited; see Section 8.16.

Further reading

Books

For various Poisson simulation methods, see the stochastic simulation books:

The book by Gentle (Section 5.2.8) also briefly covers Poisson variables.

Of course, it’s a good idea to look at the citations that the different functions use.

Articles

Here is a list of the papers I mentioned in this post:

  • 1974, Ahrens and Dieter, Computer methods for sampling from gamma, beta, poisson and bionomial distributions;
  • 1976, Fishman, Sampling from the Poisson distribution on a computer;
  • 1979, Atkinson, The computer generation of Poisson random variables;
  • 1979, Atkinson, Recent developments in the computer generation of Poisson random variables;
  • 1980, Ahrens and Dieter, Sampling from binomial and Poisson distributions: a method with bounded computation times;
  • 1980, Devroye, The Computer Generation of Poisson Random Variables;
  • 1981, Schmeiser and Kachitvichyanukul, Poisson Random Variate Generation;
  • 1982, Ahrens and Dieter, Computer generation of Poisson deviates from modified normal distributions;
  • 1983, Ripley, Computer Generation of Random Variables: A Tutorial;
  • 1993, Hörmann, The transformed rejection method for generating Poisson random variable.

Simulating Poisson random variables – Direct method

If you were to write from scratch a program that simulates a homogeneous Poisson point process, the trickiest part would be the random number of points, which requires simulating a Poisson random variable. In previous posts on simulating this point process, such as this one and this one, I’ve simply used the inbuilt functions for simulating (or generating) Poisson random variables (or variates).1In the literature, researchers describe methods for generating random deviates or variates. But, in my informal way, I will often say simulate random variables or generate random variates, somewhat interchangeably.

But how would one create such a Poisson function using just a standard uniform random variate generator? In this post I present my own Poisson simulation code in MATLAB, Python, C and C#, which can be found here.

The method being used depends on the value of the Poisson parameter, denoted here by \(\lambda\), which is the mean (as well as the variance) of a random variable with a Poisson distribution. If this parameter value is small, then a direct simulation method can be used to generate Poisson random variates. In practice a small Poisson parameter is a number less than some number between 10 to 30.

For large \(\lambda\) values, other methods are generally used, such as rejection or (highly accurate) approximation methods. In the book Non-uniform random variate generation, the author Luc Devroye groups the methods into five categories (Section X.3.2), which I briefly describe in the next post. The first of those categories covers the method that I mentioned above. I will cover that method in this post, presenting some Poisson sampling code in C and C#. (I will also present some code in MATLAB, but you would never use it instead of the the inbuilt function poissrnd.)

In the next post, I’ll describe other types of Poisson simulation methods, and I’ll detail which simulation methods various programming libraries use.

Direct method

An elegant and natural method for simulating Poisson variates is to use a result based on the homogeneous Poisson stochastic process. The points in time when a homogeneous Poisson stochastic process increases forms a Poisson point process on the real line. 2Confusingly, the term Poisson process is often used to refer to both the stochastic process and the point process, but there is a slight difference.

Using exponential random variables

Here’s the algorithm for sampling Poisson variables with exponential random variables, which I’ll explain.

Sample Poisson random variable \(N\) with parameter (mean) \(\lambda\) using exponential random variables
    1. Set count variable \(N=0\) and initial sum variable \(S=0\);
    2. While \(S<1\):
      1. Sample uniform random variable \(U\sim U(0,1)\);
      2. Calculate \(E= -\log(U)/\lambda \) ;
      3. Update count and sum variables by setting \(N\rightarrow N+1\) and \(S\rightarrow S+E\);
    3. Return N;

The point in time when the Poisson stochastic process increases are called arrival times or occurrence times. In classic random models they represent the arrivals or occurrences of something, such as phone calls over time. The differences between consecutive times are called inter-arrival times or inter-occurrence times. The inter-arrival times of a homogeneous Poisson process form independent exponential random variables, a result known as the Interval Theorem.

Using this connection to the Poisson stochastic process, we can generate exponential variables \(E_1\), \(E_2, \dots \), and add them up. The smallest number of exponential variables for the resulting sum to exceeds one will give a Poisson random variable. That is, if we define \(N\) to be the smallest \(n\) such that
$$ \sum_{k=1}^{n+1} E_k > 1, $$
then \(N\) is a random variable distributed according to a Poisson distribution.

Generating exponential variates is easily done by using the inverse method. For a uniform random variable \(U\) on the unit interval \((0,1)\), the transformation \(E= -\log(U)/\lambda \) gives an exponential random variable with mean \(1/\lambda\).

But we can skip generating exponential random variates.

Using uniform random variables

Here’s the algorithm for sampling Poisson variables with uniform random variables.

Sample Poisson random variable \(N\) with parameter (mean) \(\lambda\) using uniform random variables
    1. Set count variable \(N=0\) and initial product variable \(P=1\);
    2. While \(P>e^{-\lambda}\):
      1. Sample uniform random variable \(U\sim U(0,1)\);
      2. Update count and product variables by setting \(N\rightarrow N+1\) and \(P\rightarrow P\times U\);
    3. Return N;

To reduce computations, the direct method using exponential random variables is often reformulated as products of uniform random variables. We can do this, due to logarithmic identities, and work with products of uniform variables instead of sums of exponential random variables.

Then, by using standard uniform random variables \(U_1, U_2,\dots\), we define \(N\) to be the smallest \(n\) such that
$$ \prod_{k=1}^{n+1} U_k < e^{-\lambda}. $$

These two different formulations of the same method are captured by Lemma 3.2 and Lemma 3.3 in Chapter 10 of Devroye’s book.

Example in MATLAB

Warning: My online webpage editor tends to mangle symbols like < and >, so it’s best not to copy my code straight from this website, unless you check and edit it, and download my code directly from here.

In MATLAB, we can implement this method with the first formulation in a function with a simple while-loop:

function N=funPoissonLoop(lambda)
T=0; %initialize sum of exponential variables as zero
n=-1;%initialize counting variable as negative one

while (T &lt;1)
E=-(1/lambda)*log(rand(1));%generate exponential random variable
T=T+E; %update sum of exponential variables
n=n+1; %update number of exponential variables
end
N=n;
end

But, as I said before, don’t use this code instead of the inbuilt function poissrnd.

If you want to be a bit more tricky, you could achieve the same result by using recursion:

function N=funPoissonRecursive(lambda)
T=0; %initialize sum of exponential variables as zero
n=-1; %initialize counting variable as negative one

%run (recursive) exponential function step function
[~,N]=funStepExp(lambda,T,n);

function [T,N]=funStepExp(nu,S,m)
if (S &lt; 1)
%run if sum of exponential variables is not high enough

%generate exponential random variable
E=(-log(rand(1)))/nu;
S=S+E; %update sum of exponential variables
m=m+1; %update nunber of exponential variables

%recursively call function again
[T,N]=funStepExp(nu,S,m);
else
T=S;
N=m;
end
end
end

Note how the code recursively calls the function funStepExp, which generates an exponential variable each time.

In the Code section below I describe my code in C and C#, using the second formulation.

Origins

Some people attribute the direct method, based on inter-arrival times, to (or, at least, cite) Donald Knuth, who details it in the second volume of his classic series of books, but I doubt that the great Knuth was the first to have this idea. For example, a quick search on Google Scholar found a paper  by K. D. Tocher on computers and random sampling, where Tocher proposes the direct method in 1954, some years before Knuth started publishing his classic series.

The direct method for Poisson sampling relies upon the Interval theorem. The Poisson point process expert Günter Last studied the origins of this fundamental result. He presented its history in a recent book authored by him and Matthew Penrose; see Chapter 7 and its corresponding historical footnotes in Section C of the appendix. (A free version of the book can be found here. ) People connected to the result include Robert Ellis and William Feller who respectively lived in the 19th and 20th centuries.

Other methods

The direct method perfectly generates Poisson random variables (or I should say Poisson random variates). But it can be too slow for large values of the Poisson parameter (that, is the mean) \(\lambda\). This has motivated researchers to develop other methods, which I will mention in the next post.

Code

I wrote some code that simulates Poisson random variables by employing the direct method based on exponential inter-arrival times. As always, all my the code is online, with the code from this post being located here.

I have implemented the second formulation (using just uniform variables) in the C and C# languages. In the code, I have used a while-loop to implement the method. But I could have also used a recursion method, as I did in the MATLAB example above, which I have also done in Python (with NumPy).

For an empirical test, the code also calculates the mean and variance of a collection of Poisson variables. For a large enough number of variables, the sample mean and the variance will closely agree with each other, converging to the same value.

C

Warning: My C code uses rand(), the standard pseudo-random number function in C, which is known for failing certain tests of randomness. The function is adequate for regular simulation work. But it gives poor results for large number of simulations. Replace this function with another pseudo-random number generator.

The code for generating a single Poisson variate is fairly straightforward in C. Here’s a sample of the code with just the Poisson function:

//Poisson function -- returns a single Poisson random variable
int funPoissonSingle(double lambda)
{
double exp_lambda = exp(-lambda); //constant for terminating loop
double randUni; //uniform variable
double prodUni; //product of uniform variables
int randPoisson; //Poisson variable

//initialize variables
randPoisson = -1;
prodUni = 1;
do
{
randUni = funUniformSingle(); //generate uniform variable
prodUni = prodUni * randUni; //update product
randPoisson++; //increase Poisson variable

} while (prodUni &gt; exp_lambda);
return randPoisson;
}

For generating multiple variates, the code becomes more complicated, as one needs to use pointers, due to the memory capabilities of C. Again, the function uses the pseudo-random number generator in C.

C#

The code for generating a single Poisson variate is also straightforward in C#. Here’s the function in C#:

//Poisson function -- returns a single Poisson random variable
public int funPoissonSingle (double lambda) {
double exp_lambda = Math.Exp (-lambda); //constant for terminating loop
double randUni; //uniform variable
double prodUni; //product of uniform variables
int randPoisson; //Poisson variable

//initialize variables
randPoisson = -1;
prodUni = 1;
do {
randUni = funUniformSingle (); //generate uniform variable
prodUni = prodUni * randUni; //update product
randPoisson++; // increase Poisson variable

} while (prodUni &gt; exp_lambda);

return randPoisson;
}

Generalizing the code so it generates multiple variates just requires a little change, compared to C, as the C# language is a much more modern language.

Fortran

After this original post, I later wrote a post about implementing the same Poisson algorithm in Fortran. My Fortran code is very similar to the code that I wrote in C and C#. You should be able to run it on this website or similar ones that can compile Fortran (95) code.

Further reading

For various Poisson simulation methods, see the stochastic simulation books by Devroye (Section X.3) or Fishman (Section 8.16). There’s a free online version of Devroye’s book here. The book by Gentle (Section 5.2.8) also briefly covers Poisson variables.

In this post on generating Poisson variates, John D. Cook briefly discusses the direct method for small \(\lambda\) values and a rejection method from a 1979 paper by Atkinson, which I will mention in the next post. He presents his C# sharp code in this post.

Simulating Poisson point processes faster

As an experiment, I tried to write code for simulating many realizations of a homogeneous Poisson point process in a very fast fashion. My idea was to simulate all the realizations in two short steps.

In reality, the findings of this experiment and the contents of this post have little practical value, as computers are so fast at generating Poisson point processes. Still, it was an interesting task, which taught me a couple of things. And I did produce faster code.

MATLAB

I first tried this experiment in MATLAB.

Vectorization

In languages like MATLAB, the trick for speed is to use vectorization, which means applying a single operation to an entire vector or matrix (or array) without using an explicit for-loop. Over the years, the people behind MATLAB has advised to use vectorization instead of for-loops, as for-loops considerably slowed down MATLAB code. (But, as as time goes by, it seems using for-loops in MATLAB doesn’t slow the code down as much as it used to.)

Simulating Poisson point processes is particularly amenable to vectorization, due to the independent nature of the point process. One can simulate the number of points in each realization for all realizations in one step. Then all the points across all realizations can also be positioned in one step. In the two-dimensional case, this results in two one-dimensional arrays (or vectors, in MATLAB parlance) for the \(x\) and \(y\) coordinates.  (Of course, in my code, I could have used just one two-dimensional array/vector  for the coordinates of the points, but I didn’t.)

After generating the points, the coordinates of the points need to be grouped into the different realizations and stored in appropriate data structures.

Data structures

The problem with storing point processes is that usually each realization has a different number of points, so more sophisticated data structures than regular arrays are needed. For MATLAB, each point process realization can be stored in a data object called a cell array.  For a structure array, it’s possible for each element (that is, structure) to be a different size, making them ideal for storing objects like point processes with randomly varying sizes.

In the case of two-dimensional point processes, two cell arrays  can be used to store the \(x\) and \(y\) coordinates of all the point process realizations. After randomly positioning all the points, they can be grouped into a cell array, where each cell array element represents a realization of the Poisson point process, by using the inbuilt function MATLAB mat2cell, which converts a matrix (or array) into a cell array.

Alternatively, we could use another MATLAB data object called a structure array. In MATLAB structures have fields, which can be, for example for a point process can be the locations of the points. Given cell arrays of equal size, we can convert them into a single structure array by using the inbuilt MATLAB function struct.

Python

After successfully simulating Poisson point processes in MATLAB, I tried it in Python with the NumPy library.

Vectorization

I basically replicated what I did in MATLB using Python by positioning all the points in a single step. This gives two one-dimensional NumPy arrays for the \(x\) and \(y\) coordinates of all the point process realizations. (Again, I could have instead stored the coordinates as a single two-dimensional array, but I didn’t.)

Perhaps surprisingly, the vectorization step doesn’t speed things up much in Python with the NumPy library. This may be due to the fact that the underlying code is actually written in the C language.  That motivated me to see what methods have been implemented for simulating Poisson variables, which is the topic of the next couple posts.

Data structures

In Python, the data structure  known as a list is the natural choice. Similarly to cell arrays in MATLAB, two lists can be used for the \(x\) and \(y\) coordinates of all the points. Instead of MATLAB’s function mat2cell, I used the NumPy function numpy.split to create two lists from the two NumPy arrays containing the point coordinates.

Python does not seem to have an immediate equivalent to structure arrays in MATLAB. But in Python one can define a new data structure or class with fields, like a structure. Then one can create a list of those data structures with fields, which are called attribute references in Python.

Code

The code in MATLAB and Python can be found here. For a comparison, I also generated the same number of point process realizations (without using vectorization) by using a trusty for-loop. The code compares the times of taken for implemented the two different approaches, labelled internally as Method A and Method B. There is a some time difference in the MATLAB code, but not much of a difference in the Python case.

I have commented out the sections that create data structures (with fields or attribute references) for storing all the point process realizations, but those sections should also work when uncommented.

Placing a random point uniformly in a Voronoi cell

In the previous post, I discussed how Voronoi or Dirichlet tesselations are useful and how they can be calculated or estimated with many scientific programming languages by using standard libraries usually based on Qhull. The cells of such a tessellation divide the underlying space. Now I want to randomly place a single point in a uniform manner in each bounded Voronoi cell.

But why?

Well, this task arises occasionally, particularly when developing mathematical models of wireless networks, such as mobile or cellular phone networks. A former colleague of mine had to do this, which inspired me to write some MATLAB code a couple of years ago. And I’ve seen the question posed a couple of times on the web . So I thought: I can do that.

Overview

For this problem, I see two obvious methods.

Simple but crude

The simplest method is to cover each Voronoi cell with a rectangle or disk. Then randomly place a point uniformly on the rectangle or disk. If it doesn’t randomly land inside the rectangle or disk, then do it again until it does. Crude, slightly inefficient, but simple.

Elegant but slightly tricky

A more elegant way, which I will implement, is to partition (or divide) each Voronoi cell into triangles. Then randomly choose a triangle based on its area and, finally, uniformly position a point on that triangle.

Method

Partition cells into triangles

It is straightforward to divide a Voronoi cell into triangles. Each side of the cell corresponds to one side of a triangle (that is, two points). The third point of the triangle is the original point corresponding to the Voronoi cell.

Choose a triangle

Randomly choosing a triangle is also easy. For a given cell, number the triangles. Which random triangle is chosen is simply a discrete random variable whose probability mass function is formed from triangle areas normalized (or divided) by the total area of the Voronoi cell. In other words, the probability of randomly choosing triangle \(i\) with area \(A_i\) from \(m\) triangles is simply

\(P_i=\frac{A_i}{\sum_{j=1}^m A_j}.\)

To calculate the area of the triangles, I use the shoelace formula , which for a triangle with corners labelled \(\textbf{A}\), \(\textbf{B}\) and \(\textbf{C}\) gives

\(A= \frac{1}{2} |(x_{\textbf{B}}-x_{\textbf{A}})(y_{\textbf{C}}-y_{\textbf{A}})-(x_{\textbf{C}}-x_{\textbf{A}})(y_{\textbf{B}}-y_{\textbf{A}})|.\)

But you can also use Herron’s formula.

Then the random variable is sampled using the probabilities based on the triangle areas.

Place point on chosen triangle

Given a triangle, the final step is also easy, if you know how, which is often the case in mathematics. I have already covered this step in a previous post, but I’ll give some details here.

To position a single point uniformly in the triangle, generate two random uniform variables on the unit interval \((0,1)\), say \(U\) and \(V\). The random \(X\) and \(Y\) coordinates of the single point are given by the expressions:

\(X=\sqrt{U} x_{\textbf{A}}+\sqrt{U}(1-V x_{\textbf{B}})+\sqrt{U}V x_{\textbf{C}}\)

\(Y=\sqrt{U} y_{\textbf{A}}+\sqrt{U}(1-V y_{\textbf{B}})+\sqrt{U}V y_{\textbf{C}}\)

Results

The blue points are the points of the underlying point pattern that was used to generate the Voronoi tesselation. (These points have also been arbitrarily numbered.) The red points are the random points that have been uniformly placed in all the bounded Voronoi cells.

MATLAB

Python

Empirical validation

We can empirically validate that the points are being placed uniformly on the bounded Voronoi cells. For a given (that is, non-random) Voronoi cell, we can repeatedly place (or sample) a random point uniformly in the cell. Increasing the number of randomly placed points, the respective averages of the \(x\) and \(y\) coordinates of the points will converge to the centroids (or geometric centres) of the Voronoi cell, which can be calculated with simple formulas.

Code

The code for all my posts is located online here. For this post, the code in MATLAB and Python is here.

I have also written in MATLAB and Python the code as functions (in files funVoronoiUniform.m and funVoronoiUniform.py, respectively), so people can use it more easily. The function files are located here, where I have also included an implementation of the aforementioned empirical test involving centroids. You should be able to use those functions and for any two-dimensional point patterns.

Further reading

Much has been written on Voronoi or Dirichlet tessellations, particularly when the seeds of the cells form a Poisson point process. For references, I recommend my previous post, where I say that the references in the articles on Wikipedia and MathWorld are good starting points.

In this StackExchange post, people discuss how to place a single point uniformly on a general triangle. For the formulas, the thread cites the paper Shape distributions by Osada, Funkhouser, Chazelle and Dobkin, where no proof is given.

Voronoi tessellations

Cholera outbreaks due to public water pumps. Suburbs serviced by hospitals. Formation of crystals. Coverage regions of phone towers. We can model or approximate all these phenomena and many, many more with a geometric structure called, among other names, a Voronoi tessellation.

The main other name for this object is the Dirichlet tessellation. Historically, Dirichlet beats Voronoi, but it seems wherever I look, the name Voronoi usually wins out, suggesting an example of Stigler’s law of eponymy. A notable exception is the R library spatstat that does actually call it a Dirichlet tessellation. Wikipedia calls it a Voronoi diagram. I’ve read that Descartes studied the object even earlier than Dirichlet, but Voronoi studied it in much more depth. At any rate, I will call it a Voronoi tessellation.

To form a Voronoi tessellation, consider a collection of points scattered on some space, like the plane, where it’s easier to picture things, especially when using a Euclidean metric. Now for each point in the collection, consider the surrounding region that is closer to that point than any other point in the collection. Each region forms a cell corresponding to the point. The union of all the sets covers the underlying space. That union of sets is the Voronoi tessellation.

The evolution of Voronoi cells, which start off as disks until they collide with each other. Source: Wikipedia.

Mathematicians have extensively studied Voronoi tessellations, particularly those based on Poisson point processes, forming a core subject in the field of stochastic geometry.

Everyday Voronoi tessellations

Voronoi tessellations are just not interesting mathematical objects, as they arise in everyday situations. This piece from Scientific American website explains:

Everyone uses Voronoi tessellations, even without realizing it. Individuals seeking the nearest café, urban planners determining service area for hospitals, and regional planners outlining school districts all consider Voronoi tessellations. Each café, school, or hospital is a site from which a Voronoi tessellation is generated. The cells represent ideal service areas for individual businesses, schools, or hospitals to minimize clientele transit time. Coffee drinkers, patients, or students inside a service area (that is, a cell) should live closer to their own café, hospital, or school (that is, their own cell’s site) than any other. Voronoi tessellations are ubiquitous, yet often invisible.

Delaunay triangulation

A closely related object is the Delaunay triangulation. For a given collection of points on some underlying mathematical space, a Delaunay triangulation is formed by connecting the points and creating triangles with the condition that for each point, no other point exists in the circumcircle of the corresponding triangle. (A circumcircle is a circle that passes through all three vertices of a triangle.)

An example of Delaunay triangulation with the original points in black and centrers (in red) of the corresponding circumcircles (in grey) of the Delaunay triangles. Source: Wikipedia.

The vertices of the the Delaunay triangular and Voronoi tessellation both form graphs, which turn out to be the dual graphs of each other.

A Delaunay triangulation (in black) and the corresponding Voronoi tessellation (in red) whose vertices are the centres of the circumcircles of the Delaunay triangles. Source: Wikipedia.

Software: Qhull

Due to its applications, it’s not surprising that there exist algorithms that quickly create or estimate Voronoi tessellations. I don’t want to implement one of these algorithms from scratch, as they have already been implemented in various scientific programming languages. Many of the languages, such as MATLAB, R, and Python (SciPy) use the code from Qhull. (Note the Qhull website calls the tessellation a Voronoi diagram.)

(The Julia programming language, which I examined in a previous post, has a Voronoi package that does not use Qhull.)

Qhull finds the Voronoi tessellation by first finding the Delaunay triangulation. If the underlying space is bounded, then all the Voronoi cells are also bounded. But on an unbounded space, it is possible to have unbounded cells, meaning their areas (or volumes) are infinite. In such cases, the algorithms sometime place virtual points at infinity, but I don’t want to focus on such details. I will assume Qhull does a good job.

Code

As always, the code from all my posts is online. For this post, the MATLAB and Python code is here and here, respectively, which generates Voronoi tesselations.

MATLAB

It is fairly straightforward to create Voronoi tessellations in MATLAB. You can just use the function voronoi, which is only for two-dimensional tessellations. (Note: the MATLAB website says the behaviour of the function voronoi has changed, so that may cause problems when using different versions of MATLAB.) The function requires two inputs as vectors, say, x and y, corresponding to the Cartesian (or \(x\) and \(y\)) coordinates of the points. If you just run the voronoi command, it will create and plot a Voronoi tessellation (or Voronoi diagram, as MATLAB calls it). But the MATLAB website also describes how to plot the tessellation manually.

For \(d\) -dimensional tessellations, there is the function voronoin, which requires a single input. The single output consists of combining \(d\) column vectors for the Cartesian coordinates. For example, given the column vectors x, y and z, then the input is [x, y, z].

If you give the functions voronoi or voronoin output arguments, then the tessellation is not plotted and instead two data structures, say, v and c are created for describing the vertices of the tessellation. I generally use voronoi for plotting, but I use voronoin (and not voronoi) for generating vertex data, so I will focus on the outputs of voronoin.

For voronoin, the first (output) data structure v is simply an two-dimensional array array that contain the Cartesian coordinates of every vertex in the Voronoi tessellation. The second (output) data structure c is a cell array describing the vertices of each Voronoi cell (it has to be a cell array, as opposed to a regular array, as the cells have varying number of vertices). Each entry of the cell array contains a one-dimensional array with array indices corresponding to the \(x\) and \(y\) coordinates.

The code checks which Voronoi cells are unbounded by seeing if they have vertices at infinity, which corresponds to a \(1\) in the index arrays (stored in the structure array c).

One criticism of the MATLAB functions is that they don’t return all the information of the Voronoi tessellation. More specifically, the functions don’t return the boundaries between the unbounded cells, though voronoi internally calculates and uses these boundaries to generate Voronoi plots.  This is covered in this review on different Voronoi packages. Conversely, the Python package returns more information such as that of the edges or ridges of the Voronoi cells.

Python

To create the Voronoi tessellation, use the SciPy (Spatial) function Voronoi. This function does \(d\)-dimensional tessellations. For the two-dimensional setting, you need to input the \(x\) and \(y\) coordinates as a single array of dimensions \(2 \times n\), where \(n\) is the number of points in the collection. In my code, I start off with two one-dimensional arrays for the Cartesian coordinates, but then I combined them into a single array by using the function numpy.stack with the function argument axis =1.

I would argue that the Voronoi function in SciPy is not as intuitive to use as the MATLAB version. One thing I found a bit tricky, at first, is that the cells and the points have a different sets of numbering (that is, they are indexed differently). (And I am not the only one that was caught by this.) You must use the attribute called point_region to access a cell number (or index) from a point number (or index). In my code the attribute is accessed and then called it indexP2C, which is an integer array with cell indices. Of course, there could be a reason for this, and I am just failing to understand it.

Apart from the above criticism, the function Voronoi worked well. As I mentioned before, this package returns more Voronoi information than the MATLAB equivalents.

To plot the Voronoi tessellation, use the SciPy function voronoi_plot_2d, which allows for various plotting options, but it does require Matplotlib. The input is the data object created by the function Voronoi.

Results

I’ve plotted the results for a single realization of a Poisson point process. I’ve also plotted the indices of the points. Recall that the indexing in Python and MATLAB start respectively at zero and one.

MATLAB

Python

Voronoi animations

I took the animation of evolving Voronoi cells, which appears in the introduction, from Wikipedia. The creator generated it in MATLAB and also posted the code online. The code is long, and I wouldn’t even dare to try to reproduce it, but I am glad someone else wrote it.

Such animations exist also for other metrics. For example, the Manhattan metric (or taxi cab or city block metric) gives the animation below, where the growing disks have been replaced with squares.

A Voronoi tessellation under the Manhattan metric. The evolving cells start off as squares until they collide with each other. Source: Wikipedia.

This Wikipedia user page has animations under other metrics on Euclidean space.

This post also features animations of Voronoi tessellations when the points move.

Further reading

There is a lot of literature on Voronoi or Dirichlet tessellations, particularly when the seeds of the cells form a Poisson point process. The references in the articles on Wikipedia and MathWorld are good starting points.

Here is a good post on Voronoi tesselations. Here is a non-mathematical article published in the Irish Times.

For the more mathematically inclined, there is also the monograph Lectures on random Voronoi tessellations by Møller.

Simulating a Cox point process based on a Poisson line process

In the previous post, I described how to simulate a Poisson line process, which in turn was done by using insight from an earlier post on the Bertrand paradox.

Now, given a Poisson line process, for each line, if we generate an independent one-dimensional Poisson point point process on each line, then we obtain an example of a Cox point process. Cox point processes are also known as doubly stochastic Poisson point processes. On the topic of names, Guttorp and Thorarinsdottir argue that it should be called the Quenouille point process, as Maurice Quenouille introduced an example of it before Sir David Cox, but I opt for the more common name.

Cox point proceesses

A Cox point process is a generalization of a Poisson point process. It is created by first considering a non-negative random measure, sometimes called a driving measure. Then a Poisson point process, which is independent of the random driving measure, is generated by using the random measure as its intensity or mean measure.

The driving measure of a Cox point process can be, for example, a non-negative random variable or field multiplied by a Lebesgue measure. In our case, the random measure is the underlying Poisson line process coupled with the Lebesgue measure on the line (that is, length).

Cox processes form a very large and general family of point processes, which exhibit clustering. In previous posts, I have covered two special cases of Cox point processes: the Matérn and Thomas cluster point processes. These are, more specifically, examples of a Neyman-Scott point process, which is a special case of a shot noise Cox point process. These two point processes are fairly easy to simulate, but that’s not the case for Cox point processes in general. Some are considerably easier than others.

Motivation

I will focus on simulating the Cox point process formed from a Poisson line process with homogeneous Poisson point processes. I do this for two reasons. First, it’s easy to simulate, given we can simulate a Poisson line process. Second, it has been used and studied recently in the mathematics and engineering literature for investigating wireless communication networks in cities, where the streets correspond to Poisson lines; for example, see these two preprints:

  1. Continuum percolation for Cox point processes
  2. Poisson Cox Point Processes for Vehicular Networks

Incidentally, I don’t know what to call this particular Cox point process. A Cox line-point process? A Cox-Poisson line-point process? But it doesn’t matter for simulation purposes.

Method

We will simulate the Cox (-Poisson line-) point process on a disk. Why a disk? I suggest reading the previous posts on the Poisson line process and the Bertrand paradox for why the disk is a natural simulation window for line processes.

Provided we can simulate a Poisson line process, the simulation method is quite straightforward, as I have essentially already described it.

Line process

First simulate a Poisson line process on a disk. We recall that for each line of the line process, we need to generate two independent random variables \(\Theta\) and \(P\) describing the position of the line. The first random variable \(\Theta\) gives the line orientation, and it is a uniform random variable on the interval \((0,2\pi)\).

The second random variables \(P\) gives the distance from the origin to the disk edge, and it is a uniform random variable on the interval \((0,r)\), where \(r\) is the radius of the disk. The distance from the point \((\Theta, P)\) to the disk edge (that is, the circle) along the chord is:

$$Q=\sqrt{r^2-P^2}.$$

The endpoints of the chord (that is, the points on the disk edge) are then:

Point 1: \(X_1=P \cos \Theta+ Q\sin \Theta\), \(Y_1= P \sin \Theta- Q\cos \Theta\),

Point 2: \(X_2=P \cos \Theta- Q\sin \Theta\), \(Y_2= P \sin \Theta+Q \cos \Theta\).

The length of the line segment is \(2 Q\). We can say this random line is described by the point \((\Theta,P)\).

One-dimensional Poisson point process

For each line (segment) in the line process, simulate a one-dimensional Poisson point process on it. Although I have never discussed how to simulate a one-dimensional (homogeneous) Poisson point process, it’s essentially one dimension less than simulating a homogeneous Poisson point process on a rectangle.

More specifically, given a line segment \((\Theta,P)=(\theta,p)\), you simulate a homogeneous Poisson point process with intensity \(\mu\) on a line segment with length \(2 q\), where \(q=\sqrt{r^2-p^2}\). (I am now using lowercase letters to stress that the line is no longer random.) To simulate the homogeneous Poisson point process, you generate a Poisson random variable with parameter \(2 \mu q\).

Now you need to place the points uniformly on the line segment. To do this, consider a single point on a single line. For this point, generate a single uniform variable \(U\) on the interval \((-1,1)\). The tricky part is now getting the Cartesian coordinates right. But the above expressions for the endpoints suggest that the single random point has the Cartesian coordinates:

\(x=p \cos \theta+ U q\sin \theta\), \(y=p \sin \theta- U q\cos \theta\).

The two extreme cases of the uniform random variable \(U\) (that is, \(U=-1\) and \(U=1\)) correspond to the two endpoints of the line segment. We recall that \(Q\) is the distance from the midpoint of the line segment to the disk edge along the line segment, so it makes sense that we want to vary this distance uniformly in order to uniformly place a point on the line segment. This uniform placement step is done for all the points of the homogeneous Point process on that line segment.

You repeat this procedure for every line segment. And that’s it: a Cox point process built upon a Poisson line process.

Results

MATLAB

R

Python

Code

As always, the code from all my posts is online. For this post, I have written the code in MATLAB, R and Python.

Further reading

For the first step, the reading material is basically the same as that for the Poisson line process, which overlaps with that of the Bertrand paradox. For the one-dimensional Poisson point process, we can use the reading material on the homogeneous Poisson point process on a rectangle.

For general Cox point processes, I recommend starting with the following: Chapter 6 in the monograph Poisson Processes by Kingman; Chapter 5 in Statistical Inference and Simulation for Spatial Point Processes by Møller and Waagepetersen; and Section 5.2 in Stochastic Geometry and its Applications by Chiu, Stoyan, Kendall and Mecke. For a much more mathematical treatment, see Chapter 13 in Lectures on the Poisson Process by Last and Penrose, which is freely available online here.

For this particularly Cox point process, see the two aforementioned preprints, located here and here.

Simulating a Poisson line process

Instead of points, we can consider other objects randomly scattered on some underlying mathematical space. If we take a Poisson point process, then we can use (infinitely long) straight lines instead of points, giving a Poisson line process. Researchers have studied and used this random object to model physical phenomena. In this post I’ll cover how to simulate a homogeneous Poisson line process in MATLAB, R and Python. The code can be downloaded from here

Overview

For simulating a Poisson line process, the key question is how to randomly position the lines.  This is related to a classic problem in probability theory called the Bertrand paradox.  I discussed this illustration in probability in a previous post, where I also included code for simulating it. I highly recommend reading that post first.

The Bertrand paradox involves three methods for positioning random lines. We use Method 2 to achieve a uniform positioning of lines, meaning the number of lines and orientation of lines is statistically uniform. Then it also makes sense to use this method for simulating a homogeneous (or uniform) Poisson line process.  

We can interpret a line process as a point process. For a line process on the plane \(\textbf{R}^2\), it can be described by a point process on \((0,\infty)\times (0,2\pi)\), which is an an infinitely long cylinder. In other words, the Poisson line process can be described as a Poisson point process.

For simulating a Poisson line process, it turns out the disk is the most natural setting. (Again, this goes back to the Bertrand paradox.) More specifically, how the (infinitely long) lines intersect a disk of a fixed radius \(r>0\). The problem of simulating a Poisson line process reduces to randomly placing chords in a disk. For other simulation windows in the plane, we can always bound any non-circular region with a sufficiently large disk.

Steps

Number of lines

Of course, with all things Poisson, the number of lines will be  a Poisson random variable, but what will its parameter be? This homogeneous (or uniform) Poisson line process forms a one-dimensional homogeneous (or uniform) Poisson point process around the edge of the disk with a circumference \(2 \pi r \). Then the number of lines is simply a Poisson variable with parameter \(\lambda 2 \pi r \).

Locations of points

To position a single line uniformly in a disk, we need to generate two uniform random variables. One random variable gives the angle describing orientation of the line, so it’s a uniform random variable \(\Theta\) on the interval \((0,2\pi)\). 

The other random variable gives the distance from the origin to the disk edge, meaning it’s a uniform random variable \(P\) on the interval \((0,r)\), where \(r\) is the radius of the disk.  The random radius and its perpendicular chord create a right-angle triangle.  The distance from the point \((\Theta, P)\) to the disk edge (that is, the circle) along the chord is:

$$Q=\sqrt{r^2-P^2}.$$

The endpoints of the chord (that is, the points on the disk edge) are then:

Point 1: \(X_1=P \cos \Theta+ Q\sin \Theta\), \(Y_1= P \sin \Theta- Q\cos \Theta\),

Point 2: \(X_2=P \cos \Theta- Q\sin \Theta\), \(Y_2= P \sin \Theta+Q \cos \Theta\).

Code

I have implemented the simulation procedure in MATLAB, R and Python, which, as usual, are all very similar. I haven’t put my code here, because the software behind my website keeps mangling it.  As always, I have uploaded my code to a repository; for this post, it’s in this directory.

I have written the code in R, but I wouldn’t use it in general. That’s because if you’re using R, then, as I have said before, I strongly recommend using the powerful spatial statistics library spatstat. For a simulating Poisson line process, there’s the function rpoisline.  

The chief author of spatstat, Adrian Baddeley, has written various lectures and books on the related topics of point processes, spatial statistics, and geometric probability. In this post, he answered why the angular coordinates have to be chosen uniformly. 

Results

MATLAB

R

Python

Further reading

To read about the Poisson line process, it’s best to start with the Bertrand problem, which is covered in many works on geometric probability and related fields. A good and recent introduction is given by Calka in (Section 1.3) of the lectures titled Stochastic Geometry: Modern Research Frontiers, which were edited by Coupier and published by Springer.  Also see, for example, problem 1.2 in Geometrical Probability by Kendall and Moran or page 44 in Geometric Probability by Solomon.  

For the Poisson line process, I highly recommend Section 7.2 in the monograph Poisson Processes by Kingman. Also see Example 8.2 in the standard textbook Stochastic Geometry and its Applications by Chiu, Stoyan, Kendall and Mecke. The Poisson line process book also appears in Exercise 5.2 in the book Stochastic Simulation – Algorithms and Analysis by Asmussen and Glynn. 

For online resources, this set of lectures by Christian Lantuéjoul
covers the Poisson line process. Wilfrid Kendall covers the Poisson line process in this talk in relation to so-called Poisson cities. 

Creating a simple feedforward neural network (without using libraries)

Deep learning refers to neural networks, a type of statistical model, which are deep in the sense that they have many layers between the input and output. We can think of these layers as computational stages.(More precisely, you can think of them as big matrices.) These statistical models have now become interchangeable with the much loved term artificial intelligence (AI). But how do neural networks work?

Neural networks are collections of large — often extraordinarily large — matrices with values that have been carefully chosen (or found) so that running inputs through these matrices generates accurate outputs for certain problems like classifying photos or writing readable sentences. There are many types of neural networks, but to understand them, it’s best to start with a basic one, which is an approach I covered in a previous post.

Without using any of the neural network libraries in MATLAB or Python (of which there are several), I wrote a simple four-layer feedforward (neural) network, which is also called a multilayer perceptron. This is an unadorned neural network without any of the fancy bells and whistles that they now possess.

And that’s all you need to understand the general gist of deep learning.

Binary classification problem

I applied the simple neural network to the classic problem of binary classification. More specifically, I created a simple problem by divided two-dimensional (Cartesian) square into two non-overlapping regions. My neural network needs to identify in region a point lies in a square. A simple problem, but it is both fundamental and challenging.

I created three such problems with increasing difficulty. Here they are:

  1. Simple: Ten points of two types located in a square, where the classification border  between the two types is curve lined.
  2. Voronoi: A Voronoi tessellation is (deterministically) created with a small number of seeds (or Voronoi cells). A point can either be in a given Voronoi cell or not, hence there are two types of points.
  3. Rose: A simple diagram of a four-petal flower or rose is created using a polar coordinates. Located entirely inside a square, points can either be inside the rose or not, giving two types of points.

Components of the neural network model

Optimization method

I fitted or or trained my four-layer neural network model by using a simple stochastic gradient descent method. The field of optimization (or operations research) abounds with methods based on gradients (or derivatives), which usually fall under the category of convex optimziation.

In the code I wrote,  a random coordinate is chosen, and then the fitting (or optimization) method takes a step where the gradient is the largest, where the size of step is dictated by a fixed constant called a learning rate. This procedure is repeated for some pre-fixed number of steps. The random choosing of the coordinate is done with replacement.

This is basically the simplest training method you can use. In practice, you never use such simple methods, relying upon more complex gradient-based methods such as Adam.

Cost function

For training, the so-called cost function or loss function is a root-mean-square function,1Or \(L^2\) norm. which goes against the flow today, as most neural networks now employ cost functions based on the maximum likelihood and cross-entropy. There is a good reason why these are used instead of the root-mean-square. They work much better.

Activation function

For the activation function, the code uses the sigmoid function, but you can easily change it to use recitified linear unit (ReLU), which is what most neural networks use today. For decades, it commonly accepted to use the sigmoid function, partly because it’s smooth. But it seems only work well for small networks. The rectified linear unit reigns supreme now, as it is considerably better than the sigmoid function and others in large neural networks.

Code

I stress that this code is only for educational purposes. It’s designed to gain intuition into how (simple) neural networks do what they do.

If you have a problem that requires neural networks (or deep learning), then use one of the libraries such as PyTorch or TensorFlow. Do not use my code for such problems.

I generally found that the MATLAB code run much faster and smoother than the Python code. Python isn’t great for speed. (Serious libraries are not written in Python but C or, like much of the matrix libraries in Python, Fortran.)

Here’s my code.

MATLAB

% This code runs a simple feedforward neural network inspired.
%
% The neural network is a multi-layer perceptron designed for a simple
% binary classification. The classification is determining whether a
% two-dimensional (Cartesian) point is located inside some given region or
% not.
%
% For the simple binary examples used here, the code seems to work for
% sufficiently large number of optimization steps, typically in the 10s and
% 100s of thousands.
%
% This neural network only has 4 layers (so 2 hidden layers). The
% trainning procedure, meaning the forward and backward passes, are
% hard-coded. This means changing the number of layers requires additional
% information on the neural network architecture.
%
% It uses the sigmoid function; see the activate function.
%
% NOTE: This code is for illustration and educational purposes only. Use a
% industry-level library for real problems.
%
% Author: H. Paul Keeler, 2019.
% Website: hpaulkeeler.com
% Repository: github.com/hpaulkeeler/posts

clearvars; clc; close all;

choiceData=3; %choose 1, 2 or 3
numbSteps = 2e5; %number of steps for the (gradient) optimization method
rateLearn = 0.05; %hyperparameter
numbTest = 1000; %number of points for testing the fitted model
boolePlot=true;

rng(42); %set seed for reproducibility of results

%generating or retrieving the training data
switch choiceData
    case 1
        %%% simple example
        %recommended minimum number of optimization steps: numbSteps = 1e5
        x1 = 2*[0.1,0.3,0.1,0.6,0.4,0.6,0.5,0.9,0.4,0.7]-1;
        x2 = 2*[0.1,0.4,0.5,0.9,0.2,0.3,0.6,0.2,0.4,0.6]-1;
        numbTrainAll = 10; %number of training data
        %output (binary) data
        y = [ones(1,5) zeros(1,5); zeros(1,5) ones(1,5)];
    case 2
        %%% voronoi example
        %recommended minimum number of optimization steps: numbSteps = 1e5
        numbTrainAll = 1000; %number of training data
        x1 = 2*rand(1,numbTrainAll)-1;
        x2=2*rand(1,numbTrainAll)-1;
        booleInsideVoroni=checkVoronoiInside(x1,x2);
        % output (binary) data
        y=[booleInsideVoroni;~booleInsideVoroni];
    case 3
        %%% rose/flower example
        %recommended minimum number of optimization steps: numbSteps = 2e5
        numbTrainAll=1000; %number of training data
        x1=2*rand(1,numbTrainAll)-1;
        x2=2*rand(1,numbTrainAll)-1;
        booleInsideFlower=checkFlowerInside(x1,x2);
        %output (binary) data
        y=[booleInsideFlower;~booleInsideFlower];

end
x=[x1;x2];
booleTrain = logical(y);

%dimensions/widths of neural network
numbWidth1 = 2; %must be 2 for 2-D input data
numbWidth2 = 4;
numbWidth3 = 4;
numbWidth4 = 2; %must be 2 for binary output
numbWidthAll=[numbWidth1,numbWidth2,numbWidth3,numbWidth4];
numbLayer=length(numbWidthAll);

%initialize weights and biases
scaleModel = .5;
W2 = scaleModel * randn(numbWidth2,numbWidth1);
b2 = scaleModel * rand(numbWidth2,1);
W3 = scaleModel * randn(numbWidth3,numbWidth2);
b3 = scaleModel * rand(numbWidth3,1);
W4 = scaleModel * randn(numbWidth4,numbWidth3);
b4 = scaleModel * rand(numbWidth4,1);

%create arrays of matrices
%w matrices
arrayW{1}=W2;
arrayW{2}=W3;
arrayW{3}=W4;
%b vectors
array_b{1}=b2;
array_b{2}=b3;
array_b{3}=b4;
%activation matrices
arrayA=mat2cell(zeros(sum(numbWidthAll),1),numbWidthAll);
%delta (gradient) vectors
array_delta=mat2cell(zeros(sum(numbWidthAll(2:end)),1),numbWidthAll(2:end));

costHistory = zeros(numbSteps,1); %record the cost for each step
for i = 1:numbSteps
    %forward and back propagation
    indexTrain=randi(numbTrainAll);
    xTrain = x(:,indexTrain);

    %run forward pass
    A2 = activate(xTrain,W2,b2);
    A3 = activate(A2,W3,b3);
    A4 = activate(A3,W4,b4);

    %new (replaces above three lines)
    arrayA{1}=xTrain;
    for j=2:numbLayer
        arrayA{j}=activate(arrayA{j-1},arrayW{j-1},array_b{j-1});
    end

    %run backward pass (to calculate the gradient) using Hadamard products
    delta4 = A4.*(1-A4).*(A4-y(:,indexTrain));
    delta3 = A3.*(1-A3).*(transpose(W4)*delta4);
    delta2 = A2.*(1-A2).*(transpose(W3)*delta3);

    %new (replaces above three lines)
    A_temp=arrayA{numbLayer};
    array_delta{numbLayer-1}=A_temp.*(1-A_temp).*(A_temp-y(:,indexTrain));
    for j=numbLayer-1:-1:2
        A_temp=arrayA{j};
        delta_temp=array_delta{j};
        W_temp=arrayW{j};
        array_delta{j-1}= A_temp.*(1-A_temp).*(transpose(W_temp)*delta_temp);
    end

    %update using steepest descent
    %transpose of xTrains used for W matrices
    W2 = W2 - rateLearn*delta2*transpose(xTrain);
    W3 = W3 - rateLearn*delta3*transpose(A2);
    W4 = W4 - rateLearn*delta4*transpose(A3);
    b2 = b2 - rateLearn*delta2;
    b3 = b3 - rateLearn*delta3;
    b4 = b4 - rateLearn*delta4;

    %new (replaces above six lines)
    for j=1:numbLayer-1
        A_temp=arrayA{j};
        delta_temp=array_delta{j};
        arrayW{j}=arrayW{j} - rateLearn*delta_temp*transpose(A_temp);
        array_b{j}=array_b{j} - rateLearn*delta_temp;
    end

    %update cost
    costCurrent_i = getCost(x,y,arrayW,array_b,numbLayer);
    costHistory(i) = costCurrent_i;
end

%generating test data
xTest1 = 2*rand(1,numbTest)-1;
xTest2 = 2*rand(1,numbTest)-1;
xTest = [xTest1;xTest2];
booleTest = (false(2,numbTest));

%testing every point
for k=1:numbTest
    xTestSingle = xTest(:,k);
    %apply fitted model
    yTestSingle = feedForward(xTestSingle,arrayW,array_b,numbLayer);
    [~,indexTest] = max(yTestSingle);

    booleTest(1,k) = (indexTest==1);
    booleTest(2,k) = (indexTest==2);
end

if boolePlot

    %plot history of cost
    figure;
    semilogy(1:numbSteps,costHistory);
    xlabel('Number of optimization steps');
    ylabel('Value of cost function');
    title('History of the cost function')

    %plot training data
    figure;
    tiledlayout(1,2);
    nexttile;
    hold on;
    plot(x1(booleTrain(1,:)),x2(booleTrain(1,:)),'rs');
    plot(x1(booleTrain(2,:)),x2(booleTrain(2,:)),'b+');
    xlabel('x');
    ylabel('y');
    title('Training data');
    axis([-1,1,-1,1]);
    axis square;

    %plot test data

    nexttile;
    hold on;
    plot(xTest1(booleTest(1,:)),xTest2(booleTest(1,:)),'rd');
    plot(xTest1(booleTest(2,:)),xTest2(booleTest(2,:)),'bx');
    xlabel('x');
    ylabel('y');
    title('Testing data');
    axis([-1,1,-1,1]);
    axis square;

end

function costTotal = getCost(x,y,arrayW,array_b,numbLayer)
numbTrainAll = max(size(x));
%originally y, x1 and x2 were defined outside this function
costAll = zeros(numbTrainAll,1);

for i = 1:numbTrainAll
    %loop through every training point
    x_i = x(:,i);

    A_Last=feedForward(x_i,arrayW,array_b,numbLayer);
    %find difference between algorithm output and training data
    costAll(i) = norm(y(:,i) - A_Last,2);
end
costTotal = norm(costAll,2)^2;
end

function y = activate(x,W,b)
z=(W*x+b);
%evaluate sigmoid (ie logistic) function
y = 1./(1+exp(-z));

%evaluate ReLU (rectified linear unit)
%y = max(0,z);
end

function A_Last= feedForward(xSingle,arrayW,array_b,numbLayer)
%run forward pass
A_now=xSingle;
for j=2:numbLayer
    A_next=activate(A_now,arrayW{j-1},array_b{j-1});
    A_now=A_next;
end


A_Last=A_next;
end

function booleFlowerInside=checkFlowerInside(x1,x2)
% This function creates a simple binary classification problem.
% A single point (x1,x2) is either inside a flower petal or not, where the
% flower (or rose) is defined in polar coordinates by the equation:
%
% rho(theta) =cos(k*theta)), where k is a positive integer.

orderFlower = 2;
[thetaFlower, rhoFlower] = cart2pol(x1(:)',x2(:)');
% check if point (x1,x2) is inside the rose
booleFlowerInside = abs(cos(orderFlower*thetaFlower)) <= rhoFlower;

end

function booleVoronoiInside=checkVoronoiInside(x1,x2)
% This function creates a simple binary classification problem.
% A single point (x1,x2) is either inside a chosen Voronoi cell or not,
% where the Voronoi cells are defined deterministically below.

numbPoints = length(x1);
% generat some deterministic seeds for the Voronoi cells
numbSeed = 6;
indexCellChosen = 4; %arbitrary chosen cells from first up to this number

t = 1:numbSeed;
% a deterministic points located on the square [-1,+1]x[-1,+1]
xSeed1 = sin(27*t.*pi.*cos(t.^2*pi+.4)+1.4);
xSeed2 = sin(4.7*t.*pi.*sin(t.^3*pi+.7)+.3);
xSeed = [xSeed1;xSeed2];

% find which Voroinoi cells each point (x1,x2) belongs to
indexVoronoi = zeros(1,numbPoints);
for i = 1:numbPoints
    x_i = [x1(i);x2(i)]; %retrieve single point
    diff_x = xSeed-x_i;
    distSquared_x = diff_x(1,:).^2+diff_x(2,:).^2; %relative distance squared
    [~,indexVoronoiTemp] = min(distSquared_x); %find closest seed
    indexVoronoi(i) = indexVoronoiTemp;
end

% see if points are inside the Voronoi cell number indexCellSingle
booleVoronoiInside = (indexVoronoi==indexCellChosen);
end

Python

The use of matrices in Python are kindly described as an afterthought. So it takes a bit of Python sleight of hand to get MATLAB code translated into working Python code.

(This stems partly from the fact that Python is row-major, as the language it’s built upon, C, whereas MATLAB is column-major, as its inspiration, Fortran.)

# This code runs a simple feedforward neural network.
#
# The neural network is a multi-layer perceptron designed for a simple
# binary classification. The classification is determining whether a
# two-dimensional (Cartesian) point is located inside some given region or
# not.
#
# For the simple binary examples used here, the code seems to work for
# sufficiently large number of optimization steps, typically in the 10s and
# 100s of thousands.
#
# This neural network only has 4 layers (so 2 hidden layers). The
# trainning procedure, meaning the forward and backward passes, are
# hard-coded. This means changing the number of layers requires additional
# information on the neural network architecture.
#
# It uses the sigmoid function; see the activate function.
#
# NOTE: This code is for illustration and educational purposes only. Use a
# industry-level library for real problems.
#
# For more details, see the post:
#
# https://hpaulkeeler.com/creating-a-simple-feedforward-neural-network-without-libraries/
#
# Author: H. Paul Keeler, 2019.
# Website: hpaulkeeler.com
# Repository: github.com/hpaulkeeler/posts

import numpy as np;  # NumPy package for arrays, random number generation, etc
import matplotlib.pyplot as plt  # For plotting
#from FunctionsExamples import checkFlowerInside, checkVoronoiInside

plt.close('all');  # close all figures

choiceData=1; #choose 1, 2 or 3

numbSteps = 1e5; #number of steps for the (gradient) optimization method
rateLearn = 0.05; #hyperparameter
numbTest = 1000; #number of points for testing the fitted model
boolePlot = True;

np.random.seed(42); #set seed for reproducibility of results

#helper functions for generating problems
def checkFlowerInside(x1,x2):
    # This function creates a simple binary classification problem.
    # A single point (x1,x2) is either inside a flower petal or not, where the
    # flower (or rose) is defined in polar coordinates by the equation:
    #
    # rho(theta) =cos(k*theta)), where k is a positive integer.

    orderFlower = 2;
    thetaFlower = np.arctan2(x2,x1);
    rhoFlower = np.sqrt(x1**2+x2**2);
    # check if point (x1,x2) is inside the rose
    booleFlowerInside = np.abs(np.cos(orderFlower*thetaFlower)) <= rhoFlower;
    return booleFlowerInside

def checkVoronoiInside(x1,x2):
    # This function creates a simple binary classification problem.
    # A single point (x1,x2) is either inside a chosen Voronoi cell or not,
    # where the Voronoi cells are defined deterministically below.
    numbPoints = len(x1);
    # generat some deterministic seeds for the Voronoi cells
    numbSeed = 6;
    indexCellChosen = 4; #arbitrary chosen cells from first up to this number

    t = np.arange(numbSeed)+1;
    # a deterministic points located on the square [-1,+1]x[-1,+1]
    xSeed1 = np.sin(27*t*np.pi*np.cos(t**2*np.pi+.4)+1.4);
    xSeed2 = np.sin(4.7*t*np.pi*np.sin(t**3*np.pi+.7)+.3);
    xSeed = np.stack((xSeed1,xSeed2),axis=0);

    # find which Voroinoi cells each point (x1,x2) belongs to
    indexVoronoi = np.zeros(numbPoints);
    for i in range(numbPoints):
        x_i = np.stack((x1[i],x2[i]),axis=0).reshape(-1, 1); #retrieve single point
        diff_x = xSeed-x_i;
        distSquared_x = diff_x[0,:]**2+diff_x[1,:]**2; #relative distance squared
        indexVoronoiTemp = np.argmin(distSquared_x); #find closest seed
        indexVoronoi[i] = indexVoronoiTemp;

    # see if points are inside the Voronoi cell number indexCellSingle
    booleVoronoiInside = (indexVoronoi==indexCellChosen);
    return booleVoronoiInside


#generating or retrieving the training data
if (choiceData==1):
    ### simple example
    #recommended minimum number of optimization steps: numbSteps = 1e5
    x1 = 2*np.array([0.1,0.3,0.1,0.6,0.4,0.6,0.5,0.9,0.4,0.7])-1;
    x2 = 2*np.array([0.1,0.4,0.5,0.9,0.2,0.3,0.6,0.2,0.4,0.6])-1;
    numbTrainAll = 10; #number of training data
    #output (binary) data
    y = np.array([[1,1,1,1,1,0,0,0,0,0],[0,0,0,0,0,1,1,1,1,1]]);

    x=np.stack((x1,x2),axis=0);

if (choiceData==2):
    ### voronoi example
    #recommended minimum number of optimization steps: numbSteps = 1e5
    numbTrainAll = 500; #number of training data
    x=2*np.random.uniform(0, 1,(2,numbTrainAll))-1;
    x1 = x[0,:];
    x2 = x[1,:];
    booleInsideVoroni=checkVoronoiInside(x1,x2);
    # output (binary) data
    y=np.stack((booleInsideVoroni,~booleInsideVoroni),axis=0);

if (choiceData==3):
    ### rose/flower example
    #recommended minimum number of optimization steps: numbSteps = 2e5
    numbTrainAll=100; #number of training data
    x=2*np.random.uniform(0, 1,(2,numbTrainAll))-1;
    x1 = x[0,:];
    x2 = x[1,:];
    booleInsideFlower=checkFlowerInside(x1,x2);
    #output (binary) data
    y=np.stack((booleInsideFlower,~booleInsideFlower),axis=0);

#helper functions for training and running the neural network
def activate(x,W,b):
    z=np.matmul(W,x)+b;
    #evaluate sigmoid (ie logistic) function
    y = 1/(1+np.exp(-z));

    #evaluate ReLU (rectified linear unit)
    #y = np.max(0,z);
    return y

def feedForward(xSingle,arrayW,array_b,numbLayer):
    #run forward pass
    A_now=xSingle;
    for j in np.arange(1,numbLayer):
        A_next=activate(A_now,arrayW[j-1],array_b[j-1]);
        A_now=A_next;
    A_Last=A_next;

    return A_Last;


def getCost(x,y,arrayW,array_b,numbLayer):
    numbTrainAll = np.max(x.shape);
    #originally y, x1 and x2 were defined outside this function
    costAll = np.zeros((numbTrainAll,1));

    for i in range(numbTrainAll):
        #loop through every training point
        x_i = x[:,i].reshape(-1, 1);

        A_Last=feedForward(x_i,arrayW,array_b,numbLayer);
        #find difference between algorithm output and training data
        costAll[i] = np.linalg.norm(y[:,i].reshape(-1, 1) - A_Last,2);

        costTotal = np.linalg.norm(costAll,2)**2;

    return costTotal

#dimensions/widths of neural network
numbWidth1 = 2; #must be 2 for 2-D input data
numbWidth2 = 4;
numbWidth3 = 4;
numbWidth4 = 2; #must be 2 for binary output
numbWidthAll=np.array([numbWidth1,numbWidth2,numbWidth3,numbWidth4]);
numbLayer=len(numbWidthAll);

#initialize weights and biases
scaleModel = .5;
W2 = scaleModel * np.random.normal(0, 1,(numbWidth2,numbWidth1));
b2 = scaleModel * np.random.uniform(0, 1,(numbWidth2,1));
W3 = scaleModel * np.random.normal(0, 1,(numbWidth3,numbWidth2));
b3 = scaleModel * np.random.uniform(0, 1,(numbWidth3,1));
W4 = scaleModel * np.random.normal(0, 1,(numbWidth4,numbWidth3));
b4 = scaleModel * np.random.uniform(0, 1,(numbWidth4,1));

#create lists of matrices
#w matrices
arrayW=[];
arrayW.append(W2);
arrayW.append(W3);
arrayW.append(W4);
#b vectors
array_b=[];
array_b.append(b2);
array_b.append(b3);
array_b.append(b4);
#activation matrices
arrayA=[];
for j in range(numbLayer):
    arrayA.append(np.zeros(numbWidthAll[j]).reshape(-1, 1).T);
#delta (gradient) vectors
array_delta=[];
for j in range(numbLayer-1):
    array_delta.append(np.zeros(numbWidthAll[j+1]).reshape(-1, 1).T);

numbSteps=int(numbSteps)
costHistory = np.zeros((numbSteps,1));
booleTrain = y;
for i in range(numbSteps):
    #forward and back propagation
    indexTrain=np.random.randint(numbTrainAll);
    xTrain = x[:,indexTrain].reshape(-1, 1);

    #run forward pass
    arrayA[0]=xTrain; #treat input as the A1 matrix
    for j in (range(numbLayer-1)):
        arrayA[j+1]=activate(arrayA[j],arrayW[j],array_b[j]);

    #run backward pass (to calculate the gradient) using Hadamard products
    A_temp=arrayA[-1];
    array_delta[-1]=A_temp*(1-A_temp)*(A_temp-y[:,indexTrain].reshape(-1, 1));
    for j in np.arange(numbLayer-2,0,-1):
        A_temp=arrayA[j];
        delta_temp=array_delta[j];
        W_temp=arrayW[j];
        array_delta[j-1]= A_temp*(1-A_temp)*np.matmul(np.transpose(W_temp),delta_temp);


    #update using steepest descent
    #transpose of xTrains used for W matrices
    for j in range(numbLayer-1):
        A_temp=arrayA[j];
        delta_temp=array_delta[j];
        arrayW[j]=arrayW[j] - rateLearn*np.matmul(delta_temp,np.transpose(A_temp));
        array_b[j]=array_b[j] - rateLearn*delta_temp;


    #update cost
    costCurrent_i = getCost(x,y,arrayW,array_b,numbLayer);
    costHistory[i] = costCurrent_i;

#generating test data
xTest = 2*np.random.uniform(0,1,(2,numbTest))-1;
xTest1 = xTest[0,:];
xTest2 = xTest[1,:];

booleTest = np.zeros((2,numbTest));

#testing every point
for k in range(numbTest):
    xTestSingle = xTest[:,k].reshape(-1, 1);
    #apply fitted model
    yTestSingle = feedForward(xTestSingle,arrayW,array_b,numbLayer);
    indexTest = np.argmax(yTestSingle, axis=0);
    booleTest[0,k] = ((indexTest==0)[0]);
    booleTest[1,k] = ((indexTest==1)[0]);

if boolePlot:
    #plot history of cost
    plt.figure();
    plt.semilogy(np.arange(numbSteps)+1,costHistory);
    plt.xlabel('Number of optimization steps');
    plt.ylabel('Value of cost function');
    plt.title('History of the cost function')

    #plot training data
    fig, ax = plt.subplots(1, 2);
    ax[0].plot(x1[np.where(booleTrain[0,:])],x2[np.where(booleTrain[0,:])],\
        'rs', markerfacecolor='none');
    ax[0].plot(x1[np.where(booleTrain[1,:])],x2[np.where(booleTrain[1,:])],\
        'b+');
    ax[0].set_xlabel('x');
    ax[0].set_ylabel('y');
    ax[0].set_title('Training data');
    ax[0].set_xlim([-1, 1])
    ax[0].set_ylim([-1, 1])
    ax[0].axis('equal');

    #plot test data
    ax[1].plot(xTest1[np.where(booleTest[0,:])],xTest2[np.where(booleTest[0,:])],\
        'rd', markerfacecolor='none');
    ax[1].plot(xTest1[np.where(booleTest[1,:])],xTest2[np.where(booleTest[1,:])],\
        'bx');
    ax[1].set_xlabel('x');
    ax[1].set_ylabel('y');
    ax[1].set_title('Testing data');
    ax[1].set_xlim([-1, 1])
    ax[1].set_ylim([-1, 1])
    ax[1].axis('equal');

Results

After fitting or training the models, I tested them by applying the fitted neural network to other data. (In machine learning and statistics, you famously don’t use the same data to train and test a model.)

The number of steps needed to obtain reasonable results was about 100 thousand. To get a feeling of this, look at the plot of the cost function value over the number of optimization steps. For more complicated problems, such as the flower or rose problem, even more steps were needed.

I found the Python code, which is basically a close literal translation (by me) of the MATLAB code, too slow, so I generated the results using MATLAB.

Note: These results were generated with stochastic methods (namely, the training method), so my results will not agree exactly with yours, but hopefully they’ll be close enough.

Simple

Voronoi

Rose

The rose problem was the most difficult to classify. Sometimes it was a complete fail. Sometimes the training method could only see one component of the rose. It worked a couple of times, namely with 20 thousand optimization steps and a random seed of 42.

I imagine this problem is difficult due to the obvious complex geometry. Specifically, the both ends of each petal become thin, which is where the testing breaks down.

Fail

Half-success

Success (mostly)

Further reading

There is just so many things to read on neural networks, particularly on the web. This post was inspired by this tutorial paper:

  • 2019 – Higham and Higham, Deep Learning: An Introduction for Applied Mathematicians.

I covered this paper in a previous post.

For a readable book, I recommend this book:

  • Goodfellow, Bengio, Courville – Deep Learning – MIT Press.