Who was S.R. Broadbent?

I found myself recently wondering who the first author was of a seminal paper that created a mathematical field. I did some online digging and I noted my findings here for others who may ask the same question.

Percolation theory

The 1957 paper by S.R. Broadbent and J.M. Hammersley gave birth to percolation theory. I noticed the author affiliations:

S.R. Broadbent, United Glass Bottle Manufacturers
J.M. Hammersley, United Kingdom Atomic Energy Research Establishment Harwell

I knew John Hammersley’s name already, as he had co-written a classic book on Monte Carlo methods. Indeed, if you look at the end of the paper, you see the paper’s idea was born at an early conference on Monte Carlo methods.

But who was S.R. Broadbent? And what was he doing at a bottle factory?

Probability work

This Broadbent character was a bit mysterious. At first, it seemed as though the writer always published as S.R. Broadbent — so much so, I thought he might be a she. Such things have happened before, as the story behind the influential 1960 paper by A.H. Land and A.G. Doig demonstrated.1Alisa H. Land only died in 2021. Alison G. Doig is still alive but she has been known as Alison Harcourt and has worked as a tutor at the University of Melbourne for many, many years.

From the start I could see S.R. Broadbent was strong in probability. In the 1950s Broadbent wrote probability papers, including a 1953 paper co-written by the British father of stochastic geometry David G. Kendall. 2For those across the La Manche, the French father of stochastic geometry is Georges Matheron. The Broadbent and Kendall paper has the improbable title The Random Walk of Trichostrongylus retortaeformis. (It’s a type of larva.)

And then I was thrown by the title of a paper co-written by Broadbent in the 1960s: A computer assessment of media schedules.

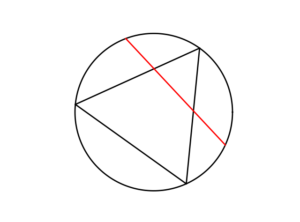
Simon says ley lines are just spatial coincidences

Then I lost track of S.R. Broadbent in terms of academic papers. I had almost given up, assuming Broadbent had left academia. But then I saw Broadbent’s name mentioned in the acknowledgements in a famous spatial statistics paper written by David Kendall in 1989. In the paper Kendalls cites a 1980 paper written by S.R. Broadbent. The subject was the statistics of ley lines — it’s a thing — showing they can be explained by mere chance. And in the acknowledgements Kendall thanks a certain Simon Broadbent — presumably he’s S.R. Broadbent whose paper Kendall cited.

Had I found the S.R. Broadbent? I was a bit skeptical, but then he’s mentioned as Simon Broadbent in this obituary of Hammersley:

Despite the title of the paper, ‘Poor man’s Monte Carlo’, the lasting contributions are the clear statement of the problem of counting self-avoiding walks, the use of subadditivity to prove the existence of the connective constant, and the discussion of random media that culminated in Simon Broadbent’s formulation of the percolation model.

That reassured me.

And then I found two 1950s papers (1954 and 1958) by a Simon Broadbent, not S.R. Broadbent, published in the Journal of the Royal Statistical Society Series C: Applied Statistics. I had actually stumbled upon the 1958 paper earlier in my searches. Initially I didn’t think it was S.R. Broadbent because the journal referred to the author as Dr Simon Broadbent, and I thought only medical doctors do that to each other. But it’s a statistics journal. So it’s probably S.R. Broadbent. Also, for this 1954 paper in the same journal they call him Mr Simon Broadbent.

And then I looked at the paper by Broadbent that David Kendall cited, and in that paper Broadbent acknowledges Kendall. And then I noticed that this paper was actually written by Simon Broadbent, but Kendall had cited the paper and written its author as S.R. Broadbent. The final link. S.R. Broadbent was Simon Broadbent — whoever that was.

I thought I had come to the end. But I hadn’t.

Advertising guru

A non-scientific article had floated up in my search results talking about the death of some big name in advertising. Seeing the title and reading the start, I thought it couldn’t be the same Simon Broadbent.

Simon asked simple questions: How does advertising work? How much advertising is enough? How can we tell whether our ad campaign has succeeded? Is adspend profitable?
When he entered advertising in the 60s, none of these questions had satisfactory answers. Many doubted they could ever be answered. Simon did more than anyone to show that advertising can contribute to profit, and that it is not a cost that can be cut with no effect on sales.

But after reading more, I realized this had to be the very same Broadbent.

He answered advertising questions with the rigour of a mathematician and the clarity of a poet. He read engineering at Cambridge, took an applauded first in mathematics and a diploma in statistics at Magdalen, Oxford, and completed his doctorate in statistics at Imperial, London. His poetry was published by Blackwell’s while he was still an undergraduate.

His lifelong interest was applying statistics to problems that nobody had thought amenable to statistical analysis. His paper to the Royal Statistical Society, In Search of the Ley Hunter, debunked claims for the existence of megalithic ley lines, pointing out that there were fewer alleged lines than would be expected from a random distribution of points between which lines could be drawn. Preparing the paper also allowed him to crawl about in Greenwich Park, testing the likely accuracy of stone-age surveying devices using instruments he had built himself.

Simon R. Broadbent made quite the impression in advertising, even being called a global legend in media research. Some of his contributions to this field are mentioned in this published tribute. It seems this field remembered him better than his original field. I couldn’t find any tributes focusing on his mathematical contributions.

Mystery solved, except for what the R stands for.

Back to percolation

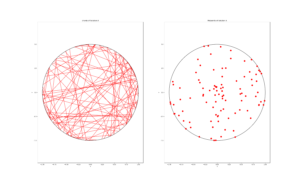
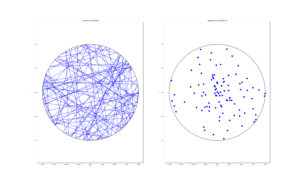
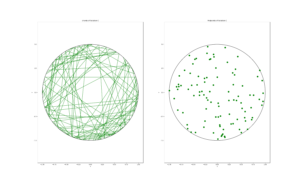
Now knowing the S stood for Simon, I noticed that Simon Broadbent is mentioned in the Wikipedia article on percolation theory. The article cites a tutorial article by John Hammersley and Dominic Welsh, which gives the original motivation of percolation theory:

The study of percolation originated from a question posed to one of us by S. R. Broadbent (see Hammersley and Morton 1954). Broadbent was at that time working at the British Coal Utilization Research Association on the design of gas masks for use in coal mines. These masks contained porous carbon granules (the medium) into which gas (the fluid) could penetrate. The pores in a granule constituted a random network of tiny interconnecting tunnels, into which the gas could move by surface adsorption; and the question was what properties of such a random network would assist or inhibit the uptake of gas. If the pores were large enough and richly enough connected, the gas could permeate the interior of a granule; but if the pores were too small or inadequately connected, the gas could not get beyond the outer surface of a granule. Thus there was a critical point, above which the mask worked well and below which it was ineffective. Critical phenomena of this sort are typical of percolation processes, and do not, normally arise in ordinary diffusion.

The original Broadbent and Hammersley paper did mention that Broadbent had previously worked at British Coal Utilisation Research Association (BCURA).

(Another aside, the same Wikipedia article says Rosalind Franklin, whose X-ray work helped reveal the structure of DNA, also worked on porous material at the British Coal Utilisation Research Association, before leaving in 1946, which I guess was before Broadbent started working there. You can read about her career, for example, here.)

Summary

Simon R. Broadbent was a trained engineer and mathematician who co-founded the thriving mathematical discipline of percolation theory, before leaving that world to go revolutionize the field of advertising by using quantitative methods and writing influential books.

Summary: Poisson simulations

Here’s a lazy summary post where I list all the posts on various Poisson simulations. I’ve also linked to code, which is found on this online repository. The code is typically written in MATLAB and Python.

Posts

Poisson point processes

Some simulations of Poisson point processes are also covered in this post on the Julia programming language:

Checking simulations

Poisson line process

Poisson random variables

Simulating a Poisson line process

Instead of points, we can consider other objects randomly scattered on some underlying mathematical space. If we take a Poisson point process, then we can use (infinitely long) straight lines instead of points, giving a Poisson line process. Researchers have studied and used this random object to model physical phenomena. In this post I’ll cover how to simulate a homogeneous Poisson line process in MATLAB, R and Python. The code can be downloaded from here

Overview

For simulating a Poisson line process, the key question is how to randomly position the lines.  This is related to a classic problem in probability theory called the Bertrand paradox.  I discussed this illustration in probability in a previous post, where I also included code for simulating it. I highly recommend reading that post first.

The Bertrand paradox involves three methods for positioning random lines. We use Method 2 to achieve a uniform positioning of lines, meaning the number of lines and orientation of lines is statistically uniform. Then it also makes sense to use this method for simulating a homogeneous (or uniform) Poisson line process.  

We can interpret a line process as a point process. For a line process on the plane \(\textbf{R}^2\), it can be described by a point process on \((0,\infty)\times (0,2\pi)\), which is an an infinitely long cylinder. In other words, the Poisson line process can be described as a Poisson point process.

For simulating a Poisson line process, it turns out the disk is the most natural setting. (Again, this goes back to the Bertrand paradox.) More specifically, how the (infinitely long) lines intersect a disk of a fixed radius \(r>0\). The problem of simulating a Poisson line process reduces to randomly placing chords in a disk. For other simulation windows in the plane, we can always bound any non-circular region with a sufficiently large disk.

Steps

Number of lines

Of course, with all things Poisson, the number of lines will be  a Poisson random variable, but what will its parameter be? This homogeneous (or uniform) Poisson line process forms a one-dimensional homogeneous (or uniform) Poisson point process around the edge of the disk with a circumference \(2 \pi r \). Then the number of lines is simply a Poisson variable with parameter \(\lambda 2 \pi r \).

Locations of points

To position a single line uniformly in a disk, we need to generate two uniform random variables. One random variable gives the angle describing orientation of the line, so it’s a uniform random variable \(\Theta\) on the interval \((0,2\pi)\). 

The other random variable gives the distance from the origin to the disk edge, meaning it’s a uniform random variable \(P\) on the interval \((0,r)\), where \(r\) is the radius of the disk.  The random radius and its perpendicular chord create a right-angle triangle.  The distance from the point \((\Theta, P)\) to the disk edge (that is, the circle) along the chord is:

$$Q=\sqrt{r^2-P^2}.$$

The endpoints of the chord (that is, the points on the disk edge) are then:

Point 1: \(X_1=P \cos \Theta+ Q\sin \Theta\), \(Y_1= P \sin \Theta- Q\cos \Theta\),

Point 2: \(X_2=P \cos \Theta- Q\sin \Theta\), \(Y_2= P \sin \Theta+Q \cos \Theta\).

Code

I have implemented the simulation procedure in MATLAB, R and Python, which, as usual, are all very similar. I haven’t put my code here, because the software behind my website keeps mangling it.  As always, I have uploaded my code to a repository; for this post, it’s in this directory.

I have written the code in R, but I wouldn’t use it in general. That’s because if you’re using R, then, as I have said before, I strongly recommend using the powerful spatial statistics library spatstat. For a simulating Poisson line process, there’s the function rpoisline.  

The chief author of spatstat, Adrian Baddeley, has written various lectures and books on the related topics of point processes, spatial statistics, and geometric probability. In this post, he answered why the angular coordinates have to be chosen uniformly. 

Results

MATLAB

R

Python

Further reading

To read about the Poisson line process, it’s best to start with the Bertrand problem, which is covered in many works on geometric probability and related fields. A good and recent introduction is given by Calka in (Section 1.3) of the lectures titled Stochastic Geometry: Modern Research Frontiers, which were edited by Coupier and published by Springer.  Also see, for example, problem 1.2 in Geometrical Probability by Kendall and Moran or page 44 in Geometric Probability by Solomon.  

For the Poisson line process, I highly recommend Section 7.2 in the monograph Poisson Processes by Kingman. Also see Example 8.2 in the standard textbook Stochastic Geometry and its Applications by Chiu, Stoyan, Kendall and Mecke. The Poisson line process book also appears in Exercise 5.2 in the book Stochastic Simulation – Algorithms and Analysis by Asmussen and Glynn. 

For online resources, this set of lectures by Christian Lantuéjoul
covers the Poisson line process. Wilfrid Kendall covers the Poisson line process in this talk in relation to so-called Poisson cities. 

The Bertrand paradox

Mathematical paradoxes are results or observations in mathematics that are (seemingly) conflicting, unintuitive, incomprehensible, or just plain bizarre. They come in different flavours, such as those that play with notions of infinity, which means they often make little or no sense in a physical world. Other paradoxes, particularly those in probability, serve as a lesson that the problem needs to be posed in a precise manner. The Bertrand paradox is one of these.

Joseph Bertrand posed the original problem in his 1889 book Calcul des probabilités, which is available online (in French); page 4, Section 5. It’s a great illustrative problem involving simple probability and geometry, so it often appears in literature on the (closely related) mathematical fields of geometric probability and integral geometry.

Based on constructing a random chord in a circle, Bertrand’s paradox involves a single mathematical problem with three reasonable but different solutions. It’s less a paradox and more a cautionary tale. It’s really asking the question: What exactly do you mean by random?

Consequently, over the years the Bertrand paradox has inspired debate, with papers arguing what the true solution is. I recently discovered it has even inspired some passionate remarks on the internet; read the comments at www.bertrands-paradox.com.

Update: The people from Numberphile and 3Blue1Brown have recently produced a video on YouTube describing and explaining the Bertrand paradox.

But I am less interested in the different interpretations or philosophies of the problem. Rather, I want to simulate the three solutions. This is not very difficult, provided some trigonometry and knowledge from a previous post, where I describe how to simulate a (homogeneous) Poisson point process on the disk.

I won’t try to give a thorough analysis of the solutions, as there are much better websites doing that. For example, this MIT website gives a colourful explanation with pizza and fire-breathing monsters. The Wikipedia article also gives a detailed though less creative explanation for the three solutions.

My final code in MATLAB, R and Python code is located here.

The Problem

Bertrand considered a circle with an equilateral triangle inscribed it. If a chord in the circle is randomly chosen, what is the probability that the chord is longer than a side of the equilateral triangle?

The Solution(s)

Bertrand argued that there are three natural but different methods to randomly choose a chord, giving three distinct answers. (Of course, there are other methods, but these are arguably not the natural ones that first come to mind.)

Method 1: Random endpoints

On the circumference of the circle two points are randomly (that is, uniformly and independently) chosen, which are then used as the two endpoints of the chord.

The probability of this random chord being longer than a side of the triangle is one third.

Method 2: Random radius

A radius of the circle is randomly chosen (so the angle is chosen uniformly), then a point is randomly (also uniformly) chosen along the radius, and then a chord is constructed at this point so it is perpendicular to the radius.

The probability of this random chord being longer than a side of the triangle is one half.

Method 3: Random midpoint

A point is randomly (so uniformly) chosen in the circle, which is used as the midpoint of the chord, and the chord is randomly (also uniformly) rotated.

The probability of this random chord being longer than a side of the triangle is one quarter.

Simulation

All three answers involve randomly and independently sampling two random variables, and then doing some simple trigonometry. The setting naturally inspires the use of polar coordinates. I assume the circle has a radius \(r\) and a centre at the origin \(o\). I’ll arbitrarily number the end points one and two.

In all three solutions we need to generate uniform random variables on the interval \((0, 2\pi)\) to simulate random angles. I have already done this a couple of times in previous posts such as this one.

Method 1: Random endpoints

This is probably the most straightforward solution to simulate. We just need to simulate two uniform random variables \(\Theta_1\) and \(\Theta_2\) on the interval \((0, 2\pi)\) to describe the angles of the two points.

The end points of the chord (in Cartesian coordinates) are then simply:

Point 1: \(X_1=r \cos \Theta_1\), \(Y_1=r \sin \Theta_1\),

Point 2: \(X_2=r \cos \Theta_2\), \(Y_2=r \sin \Theta_2\).

Method 2: Random radius

This method also involves generating two uniform random variables. One random variable \(\Theta\) is for the angle, while the other \(P\) is the random radius, which means generating the random variable \(P\) on the interval \((0, r)\).

I won’t go into the trigonometry, but the random radius and its perpendicular chord create a right-angle triangle. The distance from the point \((\Theta, P)\) to the circle along the chord is:

$$Q=\sqrt{r^2-P^2}.$$

The endpoints of the chord are then:

Point 1: \(X_1=P \cos \Theta+ Q\sin \Theta\), \(Y_1= P \sin \Theta- Q\cos \Theta\),

Point 2: \(X_2=P \cos \Theta- Q\sin \Theta\), \(Y_2= P \sin \Theta+Q \cos \Theta\).

Take note of the signs in these expressions.

Method 3: Random midpoint

This method requires placing a point uniformly on a disk, which is also done when simulating a homogeneous Poisson point process on a disk, and requires two random variables \(\Theta’\) and \(P’\). Again, the angular random variable \(\Theta’\) is uniform.

The other random variable \(P’\) is not uniform. For \(P’\), we generate a random uniform variable on the unit interval \((0,1)\), and then we take the square root of it. We then multiply it by the radius, generating a random variable between \(0\) and \(r\). (We must take the square root because the area element of a sector is proportional to the radius squared, and not the radius.) The distribution of this random variable is an example of the triangular distribution.

The same trigonometry from Method 2 applies here, which gives the endpoints of the chord as:

Point 1: \(X_1=P’ \cos \Theta’+ Q’\sin \Theta’\), \(Y_1= P’ \sin \Theta’- Q’\cos \Theta’\),

Point 2: \(X_2=P’\cos \Theta’- Q’\sin \Theta’\), \(Y_2= P’\sin \Theta’+Q’ \cos \Theta’\),

where \(Q’:=\sqrt{r^2-{P’}^2}\). Again, take note of the signs in these expressions.

Results

To illustrate how the three solutions are different, I’ve plotted a hundred random line segments and their midpoints side by side. Similar plots are in the Wikipedia article.

Method 1: Random endpoints
Method 2: Random radius

Method 3: Random midpoint

Conclusion

For the chord midpoints, we know and can see that Method 3 gives uniform points, while Method 2 has a concentration of midpoints around the circle centre. Method 1 gives results that seem to somewhere between Method 2 and 3 in terms of clustering around the circle centre.

For the chords, we see that Method 3 results in fewer chords passing through the circle centre. Methods 1 and 2 seem to give a similar number of lines passing through this central region.

It’s perhaps hard to see, but it can be shown that Method 2 gives the most uniform results. By this, I mean that the number of lines and their orientations statistically do not vary in different regions of the circle.

We can now position random lines in uniform manner. All we need now is a Poisson number of lines to generate something known as a Poisson line process, which will be the subject of the next post.

Further reading

I’ve already mentioned that there are some good websites on the topic of the Bertrand paradox. For example:

www.bertrands-paradox.com

web.mit.edu/tee/www/bertrand

www.cut-the-knot.org/bertrand.shtml

mathworld.wolfram.com/BertrandsProblem.html

Various authors have mentioned or discussed the Bertrand paradox in books on the related subjects of geometric probability, integral geometry and stochastic geometry. A good and recent introduction is given by Calka in Section 1.3 of the published lectures Stochastic Geometry: Modern Research Frontiers.

Other classic books that cover the topic including, for example, see Problem 1.2 in Geometrical Probability by Kendall and Moran. (Despite Maurice G. Kendall writing a book on geometric probability, he was not related to stochastic geometry pioneer David G Kendall.) It’s also discussed on page 44 in Geometric Probability by Solomon. For a book that involves more advance knowledge of geometry and (abstract) algebra, see Chapter 3 in Integral Geometry and Geometric Probability by Santaló.

The Bertrand paradox is also in The Pleasures of Probability by Isaac. It’s covered in a non-mathematical way in the book Paradoxes from A to Z by Clark. Edwin Jaynes studied the problem and proposed a solution in a somewhat famous 1973 paper, titled The Well-Posed Problem.

The original problem can be read in French in Bertrand’s work, which is available online here or here (starting at the bottom of page 4).

Code

The MATLAB, R and Python code can be found here. In the code, I have labelled the methods A, B and C instead 1, 2 and 3.