The Box-Muller method for simulating normal variables

In the previous post, I covered a simple but much used method for simulating random variables or, rather, generating random variates. To simulate a random variable, the method requires writing down, in a tractable manner, the inverse of its cumulative distribution function.

But in the case of the normal (or Gaussian) distribution, there is no closed-form expression for its cumulative distribution function nor its inverse. This means you cannot, in an elegant and fast way at least, generate with the inverse method a single normal random variable using a single uniform random variable.

Interestingly, however, you can generate two (independent) normal variables with two (independent) uniform variables using the Box-Muller method, originally proposed by George Box and Mervin E. Muller. This approach uses the inverse method, but in practice it’s not used much (see below). I detail this method because I find it neat and it highlights the connection between the normal distribution and rotational symmetry, which has been the subject of some recent 3Blue1Brown videos on YouTube.

(This method was also used to simulate the Thomas point process, which I covered in a previous post.)

Incidentally, this connection is also mentioned in a previous post on simulating a Poisson point process on the surface of a sphere.  In that method post, Method 2 uses an observation by the Muller that normal random variables can be used to position points uniformly on spheres.

I imagine this method was first observed by transforming two normal variables, instead of guessing various distribution pairs that would work.  Then I’ll sketch the proof in the opposite direction, though it works in both directions.

Proof outline

The joint probability density of two independent variables is simply the product of the two individual probabilities densities. Then the joint density of two standard normal variables is

$$\begin{align}f_{X,Y}(x,y)&=\left[\frac{1}{\sqrt{2\pi}}e^{-x^2/2}\right]\left[\frac{1}{\sqrt{2\pi}}e^{-y^2/2}\right]\\&=\frac{1}{{2\pi}}e^{-(x^2+y^2)/2}\,.\end{align}$$

Now it requires a change of coordinates in two dimensions (from Cartesian to polar) using a Jacobian determinant, which in this case is \(|J(\theta,r)=r|\).1Alternatively, you can simply recall the so-called area element \(dA=r\,dr\,d\theta\).  giving a new joint probability density

$$f_{\Theta,R}(\theta,r)=\left[\frac{1}{\sqrt{2\pi}}\right]\left[ r\,e^{-r^2/2}\right]\,.$$

Now we just identify the two probability densities. The first probability density corresponds to a uniform variable on \([0, 2\pi]\), whereas the second is that of a Rayleigh variable with parameter \(\sigma=1\). Of course the proof works in the opposite direction because the transformation (between Cartesian and polar coordinates) is a one-to-one function.

Algorithm

Here’s the Box-Muller method for simulating two (independent) standard normal variables with two (independent) uniform random variables.

Two (independent) standard normal random variable \(Z_1\) and \(Z_2\)

  1. Generate two (independent) uniform random variables \(U_1\sim U(0,1)\) and \(U_2\sim U(0,1)\).
  2. Return \(Z_1=\sqrt{-2\ln U_1}\cos(2\pi U_2)\) and \(Z_2=\sqrt{-2\ln U_1}\sin(2\pi U_2)\).

The method effectively samples a uniform angular variable \(\Theta=2\pi U_2\) on the interval \([0,2\pi]\) and a radial variable \(R=\sqrt{-2\ln U_1}\) with a Rayleigh distribution.

The algorithm produces two independent standard normal variables. Of course, as many of us learn in high school, if \(Z\) is a standard normal variable, then the random variable \(X=\sigma Z +\mu\) is a normal variable with mean \(\mu\) and standard deviation \(\sigma>0\) .

The Box-Muller method is rarely used

Sadly this method isn’t typically used, as historically computer processors were slow at doing the calculations, so other methods were employed such as the ziggurat algorithm. Also, although processors can now do such calculations much faster, many languages, not just scientific ones, come with functions for generating normal variables. Consequently, there’s not much need in implementing this method.

Further reading

Websites

Many websites detail this method. Here’s a couple:

Papers

The original paper (which is freely available here) is:

  • 1958 – Box and Muller, A Note on the Generation of Random Normal Deviates.

Another paper by Muller connects normal variables and the (surface of a) sphere:

  • 1959 – Muller, A note on a method for generating points uniformly on n-dimensional spheres.

Books

Many books on stochastic simulation cover the Box-Muller method. The classic book by Devroye with the descriptive title Non-Uniform Random Variate Generation covers this method; see Section 4.1. There’s also the Handbook of Monte Carlo Methods by Kroese, Taimre and Botev; see Section 3.1.2.7. Ripley also covers the method (and he makes a remark with some snark that many people incorrectly spell it the Box-Müller method); see Section 3.1. The book Stochastic Simulation: Algorithms and Analysis by Asmussen and Glynn also mention the method and a variation by Marsaglia; see Examples 2.11 and 2.12.

The inverse method for simulating random variables

We will cover a simple but much used method for simulating random variables or, rather, random variates. Although the material here is found in introductory probability courses, it frequently forms the foundation of more advance stochastic simulation techniques, such as Markov chain Monte Carlo methods.

Details

The basics of probability theory tell us that any random variable can, in theory, be written as a function of a uniform random variable \(U\) distributed on the interval \((0,1)\), which is usually written as \(U\sim U(0,1)\). All one needs is the inverse of the cumulative distribution function of the desired random variable.

More specifically, let \(X\) be a random variable with a cumulative distribution function \(F(x)=\mathbb{P}(X\leq x)\). The function \(F\) is nondecreasing in \(x\), so its inverse can be defined as \(F^{-1}(y)=\inf\{x:F(x)\geq y\}\), which is known as the generalized inverse of \(F(x)\).

Some authors assume the minimum is attained so the infimum is replaced with the minimum, giving \(F^{-1}(y)=\min\{x:F(x)\geq y\}\).

In short, the following result is all that we need.

Transform of a uniform variable \(U\sim U(0,1)\)

For a uniform random variable \(U\sim U(0,1)\), the random variable \(F^{-1}(U)\) has the cumulative distribution function \(\mathbb{P}(F^{-1}(U)\leq x)=P(U\leq F(x))=F(x)\).

Algorithm

The above observation gives a method, which I like to call the direct method, for exactly simulating a random variable \(X\) with the (cumulative) distribution (function) \(F\).

Random variable \(X\) with distribution \(F\)

  1. Sample a uniform random variable \(U\sim U(0,1)\), giving a value \(u\).
  2. Return the value \(x=F^{-1}(u)\) as the sampled value of \(U\).

But this approach only works if we can write down (in a relatively straightforward way) the inverse \(F^{-1}\), which is usually not the case. This means you cannot generate, for example, simulate a normal random variable with a single uniform random variable by using just the inverse method, as we cannot write down the inverse of its cumulative distribution function.

(Interestingly, with two (independent) uniform random variables, we can use the transform method to simulate two (independent) normal (or Gaussian) random variables. This approach is called the Box-Muller transform, which I’ll cover in another post.)

Nevertheless, we can apply the inverse method to some useful distributions.

Examples

Warning: The following examples are only for illustration purposes. Except for the Bernoulli example, you would never use them in standard scientific languages such as MATLAB, Python (with NumPy), R or Julia, because those languages already have much better functions for simulating these and many other random variables (or variates). If you are writing a function in a language that lacks such functions, I would consult one of the references mentioned below. Although the inverse method is usually intuitive and elegant, it is often not the fastest method.

Bernoulli distribution

The simplest random variable is that with the Bernoulli distribution. With probability \(p\), a Bernoulli random variable \(X\) takes the value one. Otherwise, \(X\) takes the value zero (with probability \(1-p\)). This gives the (cumulative) distribution (function):

$$ F_B(x)=\begin{cases}
0 & \text{if } x < 0 \\
1 – p & \text{if } 0 \leq x < 1 \\
1 & \text{if } x \geq 1
\end{cases}$$

This gives a very simple way to simulate (or sample) a Bernoulli variable \(X\) with parameter \(p\).

Bernoulli random variable \(X\) with parameter \(p\)

  1. Sample a uniform random variable \(U\sim U(0,1)\), giving a value \(u\).
  2. If \(u\leq p\), return \(x=1\); otherwise return \(x=0\).
Application: Acceptance simulation methods

In random simulation code, whenever you do something (or not) with some probability \(p\) (or probability \(1-p\)), then the code will perform the above step. Consequently, you see this in the (pseudo-)code of many stochastic simulations with random binary choices, particularly schemes that have an acceptance step such the Metropolis-Hastings method and other Markov chain Monte Carlo (MCMC) methods.

In MCMC schemes, a random (binary) choice is proposed and it is accepted with a certain probability, say, \(\alpha \). This is the equivalent of accepting the proposed choice if some uniform random variable \(U\) meets the condition \(U\leq \alpha\).

This explains why the pseudo-code of the same algorithm can vary. Some pseudo-code will say accept with probability \(\alpha\), while other pseudo-code will say do if \(U\leq \alpha\). It’s two equivalent formulations.

Exponential distribution

The cumulative distribution function of an exponential variable with mean \(1/\lambda\) is \(F_E(x)= 1-e^{-\lambda x}\), which has the inverse \(F^{-1}_E(y)=-(1/\mu)\ln[1-y]\). We can use the fact that on the interval \((0,1)\), a uniform variable \(U\sim U(0,1)\) and \(1-U\) have the same distribution. Consequently, the random variables \(\ln [1-U]\) and \(\ln U\) are equal in distribution.

This gives a method for simulating exponential random variables.

Exponential random variable \(X\) with mean \(1/\lambda\)

  1. Sample a uniform random variable \(U\sim U(0,1)\), giving a value \(u\).
  2. Return \(x=-(1/\lambda)\ln u\).
Application: Poisson simulation method

Of course you can use this method to simulate exponential random variables, but it has another application. In a previous post on simulating Poisson variables, I mentioned that exponential random variables can be used to simulate a Poisson random variable in a direct (or exact) manner. That method is based on the distances between the points of a homogeneous Poisson point process (on the real line) being exponential random variables.

But this method is only suitable for low values of \(\lambda\), less than say fifteen.

Rayleigh distribution

The Rayleigh distribution is \(\mathbb{P}(X\leq x)= (x/\sigma^2)e^{-x^2/(2\sigma^2)}\), where \(\sigma>0\) is its scale parameter. The square root of an exponential variable with mean \(1/\lambda\) has a Rayleigh distribution with scale parameter \(\sigma=1/\sqrt{2\lambda}\).

Consequently, the generation method is similar to the previous example.

Rayleigh random variable \(Y\) with scale parameter \(\sigma>0\)

  1. Sample a uniform random variable \(U\sim U(0,1)\), giving a value \(u\).
  2. Return \(y=\sigma\sqrt{-2\ln u}\).

Other methods

The inverse method is intuitive and often succinct. But most functions for simulating random variables (or, more correctly, generating random variates) do not use these methods, as they are not fast under certain parameter regimes, such as large means. Consequently, other method are used such as approximations (with, say, normal random variables), such as the ones I outlined in this post on simulating Poisson random variables.

More complicated random systems, such as collections of dependent variables, can be simulated using Markov chain Monte Carlo methods, which is the direction we’ll take in a couple posts after this one.

Further reading

The inverse technique is in your favourite introductory book on probability theory. The specific examples here are covered in books on stochastic simulations and Monte Carlo methods. The classic book by Devroye covers these topics; see Section 2.1 and the examples (inverse method) in Chapter 2.

For a modern take, there’s the extensive Handbook of Monte Carlo Methods by Kroese, Taimre and Botev; see Section 3.1.1, Algorithm 4.1 (Bernoulli) and Algorithm 4.29 (exponential), and Algorithm 4.66 (Rayleigh). There’s also the book Stochastic Simulation: Algorithms and Analysis by Asmussen and Gynn; in Chapter 2, see Example 2.1 (Bernoulli) and Exampe 2.3 (exponential).

Other books include those by Fishman (Section 8.1) and Gentle (Section 4.1) respectively. (Warning: the book by Gentle has a mistake on page 105 in algorithm for sampling Bernoulli variables, as noted by the author. It should be \(1-\pi\) and not \(\pi\) when zero is returned for the sampled value of the Bernoulli variable.)

Simulating a Poisson point process on a circle

In this post, I’ll take a break from the more theoretical posts. Instead I’ll describe how to simulate or sample a homogeneous Poisson point process on a circle.  I have already simulated this point process on a rectangle, triangle and disk. In some sense, I should have done this simulation method before the disk one, as it’s easier to simulate. I recommend reading that post first, as the material presented here builds off it.

Sampling a homogeneous Poisson point process on a circle is rather straightforward.  It just requires using a fixed radius and uniformly choose angles from interval \((0, 2\pi)\). But the circle setting gives an opportunity to employ a different method for positioning points uniformly on circles and, more generally, spheres. This approach uses Gaussian random variables, and it becomes much more efficient when the points are placed on high dimensional spheres.

Steps

Simulating a Poisson point process requires two steps: simulating the random number of points and then randomly positioning each point.

Number of points

The number of points of a Poisson point process on circle of radius \(r>0\) is a Poisson random variable with mean \(\lambda C\), where \(C=2\pi r\) is the circumference of the circle.  You just need to be able to need to produce (pseudo-)random numbers according to a Poisson distribution.

To generate Poisson variables in MATLAB,  use the poissrnd function with the argument \(\lambda C\).  In Python, use either the scipy.stats.poisson or numpy.random.poisson function from the SciPy or NumPy libraries. (If you’re curious how Poisson simulation works, I suggest seeing this post for details on sampling Poisson random variables or, more accurately, variates.)

Locations of points

For a homogeneous Poisson point process, we need to uniformly position points on the underlying space, which is this case is a circle. We will look at two different ways to position points uniformly on a circle. The first is arguably the most natural approach.

Method 1: Polar coordinates

We use polar coordinates due to the nature of the problem. To position all the points uniformly on a circle, we simple generate uniform numbers on the unit interval \((0,1)\). We then multiply these random numbers by \(2\pi\).

We have generated polar coordinates for points uniformly located on the circle. To plot the points, we have to convert the coordinates back to Cartesian form by using the change of coordinates:  \(x=\rho\cos(\theta)\) and \(y=\rho\sin(\theta)\).

Method 2: Normal random variables

For each point, we generate two standard normal or Gaussian random variables, say, \(W_x\) and \(W_y\), which are independent of each other. (The term standard here means the normal random variables have mean \(\mu =0\) and standard deviation \(\sigma=1\).) These two random variables are the Cartesian components of a random point.  We then rescale the two values by the Euclidean norm, giving

$$X=\frac{W_x}{(W_x^2+W_y^2)^{1/2}},$$

$$Y=\frac{W_y}{(W_x^2+W_y^2)^{1/2}}.$$

These are the Cartesian coordinates of points uniformly scattered around a unit circle with centre at the origin. We multiply the two random values \(X\) and \(Y\) by the \(r>0\)  for a circle with radius \(r\).

How does it work?

The procedure is somewhat like the Box-Muller transform in reverse. I’ll give an outline of the proof. The joint density of the random variables \(W_x\) and \(W_y\) is that of the bivariate normal distribution with zero correlation, meaning it has the joint density

$$ f(x,y)=\frac{1}{2\pi}e^{[-(x^2+y^2)/2]}.$$

We see that the function \(f\) is a constant when we trace around any line for which \((x^2+y^2)\) is a constant, which is simply the Cartesian equation for a circle (where the radius is the square root of the aforementioned constant). This means that the angle of the point \((W_x, W_y)\) will be uniformly distributed.

Now we just need to look at the distance of the random point. The vector formed from the pair of normal variables \((W_x, W_y)\) is a Rayleigh random variable.  We can see that the vector from the origin to the point \((X,Y)\) has length one, because we rescaled it with the Euclidean norm.

Results

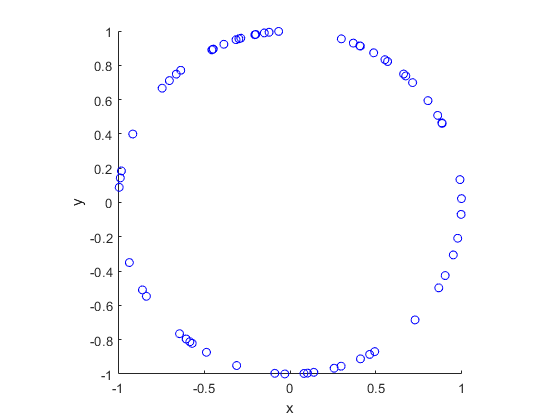
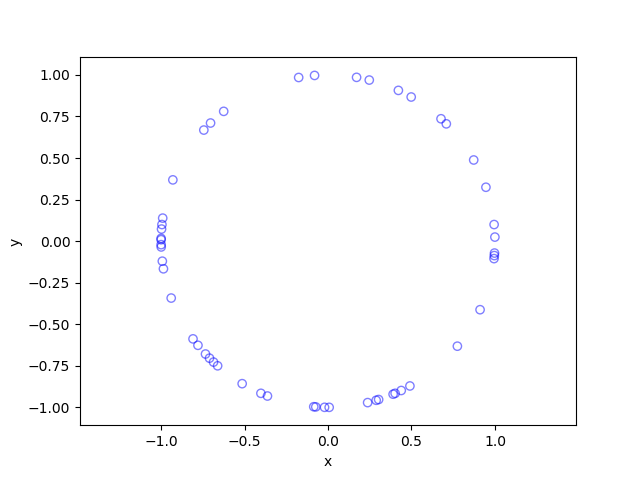
I have presented some results produced by code written in MATLAB and Python. The blue points are the Poisson points on the sphere. I have used a surface plot (with clear faces) in black to illustrate the underling sphere.

MATLAB

Python

Code

The code for all my posts is located online here. For this post, the code in MATLAB and Python is here.

Further reading

I recommend this blog post, which discusses different methods for randomly placing points on spheres and inside spheres (or, rather, balls) in a uniform manner.  (Embedded in two dimensions, a sphere is a circle and a ball is a disk.) A key paper on using normal variables is the following:

  • 1959, Muller, A note on a method for generating points uniformly on n-dimensional spheres.

As I mentioned in the post on the disk, the third edition of the classic book Stochastic Geometry and its Applications by Chiu, Stoyan, Kendall and Mecke details on page 54 how to uniformly place points on a disk.  It just requires a small modification for the circle.

The Laplace functional

When working with random variables, a couple useful tools are the characteristic function and the moment-generating function, which for a random variable \(Y\) are defined respectively as
$$
\phi_Y(t)= \mathbb{E}\left [ e^{itY} \right ]\,
$$
and
$$
M_Y(t)= \mathbb{E}\left [ e^{tY} \right ]\,,
$$
where the imaginary number \(i=\sqrt{-1}\) and the real variable \(t\in \mathbb{R}\). For continuous random variables, these two respective functions are essentially the Fourier and Laplace transforms of the probability densities. (The moment-generating function \(M(t)\) may not exist due to the integral not converging to a finite value, whereas the characteristic function \(\phi_Y(t)\) always exists.)

If \(Y\) is a discrete random variable, a useful object is the probability-generating function, which is defined as
$$
G_Y(z)= \mathbb{E}\left [z^Y \right ]\,.
$$
This function is the Z-transform of the probability mass function of the random variable \(Y\).

By using these tools, results such as sums of random variables and convergence theorems can be proven. There exist equivalent tools which prove useful for studying point processes (and, more generally random measures).

Laplace functional

For a point process \(\Phi \) defined on some underlying space \(\mathbb{S}\), such as \(\mathbb{R}^d\), the Laplace functional is defined as
$$
L_{\Phi}(f)=\mathbb{E}[e^{-\int_{ \mathbb{S}} f(x){\Phi}(dx)}]\,,
$$
where \(f\) is any (Borel) measurable non-negative function on the space \(\mathbb{S}\).

A simple point process is one for which two or more points coincide in location with probability zero. For a simple point process, we can write the random integral (or sum) using set theory notation, giving
$$
\int_{\mathbb{S}} f(x){\Phi}(dx)=\sum\limits_{x\in \Phi} f(x) \,.
$$

Name

Why’s it called a Laplace functional? From its definition, it’s clear that the first half of the name stems from the Laplace transform. Mapping from the space \(\mathbb{S}\), it’s called a functional because it is a function of a non-negative function \(f\).

Characterization

The Laplace functional characterizes the point process, meaning each point process (or, more generally, random measure) has its own unique Laplace functional. For a given point process, the challenge is to derive the mathematical expression for the Laplace functional by using its definition.

Poisson example

For deriving the Laplace functional, perhaps not surprisingly, one of the easiest one of the easiest point processes is the Poisson point process due to its independence property. For a Poisson process \(\Phi\) with intensity measure \(\Lambda\) defined on the state space \(\mathbb{S}\), the Laplace functional is given by
$$
L_{\Phi}(f)=e^{-\int_{ \mathbb{S}} [1-e^{-f(x)}]\,\Lambda(dx) } \,.
$$

If the Poisson point process is homogeneous, then

$$
L_{\Phi}(f)=e^{-\lambda\int_{ \mathbb{S}} [1-e^{-f(x)}]\,dx } \,,
$$

where \(\lambda\) is the intensity function (that is, the average density of points).

Applications

Proof techniques

Given a Laplace functional characterizes a point process, it can be used prove results on the distributions of point processes, where the proofs often simpler. For example, it can used to see what happens when you perform a point process operation on a point process, such as proving that the independent thinning a Poisson point process gives another Poisson point process. Laplace functionals are used to prove results on the superposition and (random or deterministic) mapping of point processes.

Interference in wireless network models

In the previous post, I covered the concept of the signal-to-interference ratio or SIR in wireless networks. (If noise is included, then then signal-to-interference-plus-noise ratio or just SINR.) Under such wireless network models, the interference term is a type of shot noise of the point process used for the transmitter locations.

Researchers commonly assume Rayleigh fading of the signal energy, which corresponds to the power values randomly varying according to an exponential distribution (due to a square root being taken). The tail distribution of an exponential variable \(F\) with mean \(\mu\) is simply \(\mathbb{P}(F>t)= e^{-t/\mu}\). This means that the exponential assumption and some conditioning arguments lead to Laplace transforms of random variables, including the interference, which can be recast as the Laplace functional of the point process used for the transmitter locations.

Related functionals

For random variables, the characteristic, moment-generating, and probability-generating functions are similarly defined and closely related. We now define two other functionals used for studying point processes.

Characteristic functional

For a point process \(\Phi \) defined on \(\mathbb{S}\), the characteristic functional is defined as
$$
L_{\Phi}(f)=\mathbb{E}[e^{i\int_{ \mathbb{S}} g(x){\Phi}(dx)}]\,,
$$
where \(i=\sqrt{-1}\) and \(g\) is any (Borel) measurable function on the space \(\mathbb{S}\).

Probability-generating functional

For a point process \(\Phi \) defined on \(\mathbb{S}\), the probability-generating functional is defined as
$$
G_{\Phi}(v)=\mathbb{E}[ \prod_{x\in \Phi } v(x)]\,,
$$
where \(v\) is any bounded non-negative (Borel) measurable function on the space \(\mathbb{S}\) such that \(0\leq v(x)\leq 1\) for any point \(x\in \mathbb{S}\). (Some authors use an alternative definition with a function \(u(x)=1-v(x)\).)

Further reading

There is a Wikipedia article on the Laplace functional.

The usual sources on point processes (and, more generally, random measures) cover Laplace functionals. For example, see section 7.2.1 of the text Stochastic Geometry and its Applications by Chiu, Stoyan, Kendall and Mecke. The Laplace and other functionals are covered in Section 9.4 of the second volume of An Introduction to the Theory of Point Processes by Daley and Vere-Jones.

Baccelli and Błaszczyszyn use the Laplace to prove some results on the Poisson point process in Section 1.2 in the first volume of Stochastic Geometry and Wireless Networks. In an approachable manner, Haenggi details the Laplace and probability-generating functionals in Stochastic Geometry for Wireless networks.

The recent book Random Measures, Theory and Applications by Kallenberg also uses Laplace functionals; see Lemma 3.1. Finally, Baccelli, Błaszczyszyn, and Karray use the Laplace functional in the recent book (manuscript) Random Measures, Point Processes, and Stochastic Geometry, but they call it a Laplace transform; see Section 1.3.2, 2.1.1 and 2.2.2, among others.

Simulating a Thomas cluster point process

Sometimes with just a little tweaking of a point process, you can get a new  point process. An example of this is the Thomas point process, which is a type of cluster point process, meaning that its randomly located points tend to form random clusters.  This point process is an example of a family of cluster point processes known as Neyman-Scott point processes, which have been used as models in spatial statistics and telecommunications. If that sounds familiar, that is because this point process is very similar to the Matérn point cluster process, which I covered in the previous post

The only difference between the two point processes is how the points are randomly located. In each cluster of a Thomas point process, each individual point is located according to two independent zero-mean normal variables with variance \(\sigma^2\), describing the \(x\) and \(y\) coordinates relative to the cluster centre, whereas each point of a Matérn point process is located uniformly in a disk.

Working in polar coordinates, an equivalent way to simulate a Thomas point process is to use independent and identically-distributed Rayleigh random variables for the radial (or \(\rho\)) coordinates, instead of using random variables with a triangular distribution, which are used to simulate the Matérn point process. This method works because in polar coordinates a uniform random variable for the angular (or \(\theta\) ) coordinate and a Rayleigh random variable for the angular (or \(\rho\)) is equivalent to in Cartesian coordinates two independent zero-mean normal variables. This is exactly the trick behind the Box-Muller transform for generating normal random variables using just uniform random variables.

If you’re familiar with simulating the Matérn point process, the most difference is what size to make the simulation window for the parents points. I cover that in the next section.  

Overview

Simulating a Thomas cluster point process requires first simulating a homogeneous Poisson point process with intensity \(\lambda>0\) on some simulation window, such as a rectangle, which is the simulation window I will use here. Then for each point of this underlying point process, simulate a Poisson number of points with mean \(\mu>0\), and for each point simulate two independent zero-mean normal variables with variance \(\sigma^2\), corresponding to the (relative) Cartesian coordinates .

The underlying  point process is sometimes called the parent (point) process, and its points are centres of the cluster disks. The subsequent point process on all the disks is called daughter (point) process and it forms the clusters. I have already written about simulating the homogeneous Poisson point processes on a rectangle and a disk, so  those posts are good starting points, and I will not focus  too much on details for these steps steps.

Importantly, like the Matérn point process, it’s possible for daughter points to appear in the simulation window that come from parents points outside the simulation window. To handle these edge effects, the point processes must be first simulated on an extended version of the simulation window. Then only the daughter points within the simulation window are kept and the rest are removed.  

We can add a strip of some width \(d\) all around the simulation window. But what value does \(d\) take? Well, in theory, it is possible that a daughter point comes from a parent point that is very far from the simulation window. But that probability becomes vanishingly small as the distance increases, due to the daughter points being located according to zero-mean normal random variables. 

For example, if a single parent is at a distance \(d=6 \sigma\) from the simulation, then there is about a $1/1 000 000 000$ chance that a single daughter point will land in the simulation window. The probability is simply \(1-\Phi(6 \sigma)\), where \(\Phi\) is the cumulative distribution function of a normal variable with zero mean and standard deviation \(\sigma>0\).  This is what they call a six sigma event.  In my code, I set \(d=6 \sigma\), but \(d=4 \sigma\) is good enough, which is the value that the R library spatstat uses by default.  

Due to this approximation, this simulation cannot be called a perfect simulation, despite the approximation being highly accurate. In practice, it will not have no measurable effect on simulation results, as the number of simulations will rarely be high enough for (hypothetical) daughter points to come from (hypothetical) parent points outside the window. 

Steps

Number of points

Simulate the underlying or parent Poisson point process on the rectangle with \(N_P\) points. Then for each point, simulate a Poisson number of points, where each disk now has \(D_i\) number of points. Then the total number of points is simply \(N=D_1+\dots +D_{P}=\sum_{i=1}^{N_P}D_i \). The random variables \(P\) and \(D_i\) are Poisson random variables with respective means \(\lambda A\) and \(\mu\), where \(A\) is the area of the rectangular simulation window. To simulate these random variables in MATLAB, use the poissrnd function. To do this in R, use the  standard function rpois. In Python, we can use either functions scipy.stats.poisson or numpy.random.poisson from the SciPy or NumPy libraries.

Locations of points

The points of the parent point process are randomly positioned by using Cartesian coordinates. For a homogeneous Poisson point process, the \(x\) and \(y\) coordinates of each point are independent uniform points, which is also the case for the binomial point process, covered in an earlier post.

As mentioned in the introduction of this post, the points of all the daughter point process are randomly positioned by either using polar  coordinates or Cartesian coordinates, due to the Box-Muller transform. But because we ultimately convert back to Cartesian coordinates (for example, to plot the points), we will work entirely in this coordinate system.  Each point is then simply positioned with two independent zero-mean normal random variables, representing the \(x\) and \(y\) coordinates relative to the original parent point.

Shifting all the points in each cluster disk

In practice (that is, in the code), all the daughter points are simulated relative to the origin. Then for each cluster disk, all the points need to be shifted, so the origin coincides with the parent point, which completes the simulation step.

To use vectorization in the code,  the coordinates of each cluster point are repeated by the number of daughters in the corresponding cluster by using the functions repelem in MATLAB, rep in R, and repeat in Python. 

Code

I have implemented the simulation procedure in MATLAB, R and Python, which as usual are all very similar. The code can be downloaded here.

MATLAB
 %Simulation window parameters xMin=-.5; xMax=.5; yMin=-.5; yMax=.5; %Parameters for the parent and daughter point processes lambdaParent=10;%density of parent Poisson point process lambdaDautgher=100;%mean number of points in each cluster sigma=0.05;%sigma for normal variables (ie random locations) of daughters %Extended simulation windows parameters rExt=7*sigma; %extension parameter -- use factor of deviation %for rExt, use factor of deviation sigma eg 6 or 7 xMinExt=xMin-rExt; xMaxExt=xMax+rExt; yMinExt=yMin-rExt; yMaxExt=yMax+rExt; %rectangle dimensions xDeltaExt=xMaxExt-xMinExt; yDeltaExt=yMaxExt-yMinExt; areaTotalExt=xDeltaExt*yDeltaExt; %area of extended rectangle %Simulate Poisson point process for the parents numbPointsParent=poissrnd(areaTotalExt*lambdaParent,1,1);%Poisson number %x and y coordinates of Poisson points for the parent xxParent=xMinExt+xDeltaExt*rand(numbPointsParent,1); yyParent=yMinExt+yDeltaExt*rand(numbPointsParent,1); %Simulate Poisson point process for the daughters (ie final poiint process) numbPointsDaughter=poissrnd(lambdaDautgher,numbPointsParent,1); numbPoints=sum(numbPointsDaughter); %total number of points %Generate the (relative) locations in Cartesian coordinates by %simulating independent normal variables xx0=normrnd(0,sigma,numbPoints,1); yy0=normrnd(0,sigma,numbPoints,1); %replicate parent points (ie centres of disks/clusters) xx=repelem(xxParent,numbPointsDaughter); yy=repelem(yyParent,numbPointsDaughter); %translate points (ie parents points are the centres of cluster disks) xx=xx(:)+xx0; yy=yy(:)+yy0; %thin points if outside the simulation window booleInside=((xx&amp;amp;amp;amp;amp;gt;=xMin)&amp;amp;amp;amp;amp;amp;(xx&amp;amp;amp;amp;amp;lt;=xMax)&amp;amp;amp;amp;amp;amp;(yy&amp;amp;amp;amp;amp;gt;=yMin)&amp;amp;amp;amp;amp;amp;(yy&amp;amp;amp;amp;amp;lt;=yMax)); %retain points inside simulation window xx=xx(booleInside); yy=yy(booleInside); %Plotting scatter(xx,yy); 
R

Note: it is a bit tricky to write “<-” in the R code (as it automatically changes to the html equivalent in the HTML editor I am using), so I have usually used “=” instead of the usual “<-”.

 #Simulation window parameters xMin=-.5; xMax=.5; yMin=-.5; yMax=.5; #Parameters for the parent and daughter point processes lambdaParent=10;#density of parent Poisson point process lambdaDaughter=100;#mean number of points in each cluster sigma=0.05; #sigma for normal variables (ie random locations) of daughters #Extended simulation windows parameters rExt=7*sigma; #extension parameter #for rExt, use factor of deviation sigma eg 6 or 7 xMinExt=xMin-rExt; xMaxExt=xMax+rExt; yMinExt=yMin-rExt; yMaxExt=yMax+rExt; #rectangle dimensions xDeltaExt=xMaxExt-xMinExt; yDeltaExt=yMaxExt-yMinExt; areaTotalExt=xDeltaExt*yDeltaExt; #area of extended rectangle #Simulate Poisson point process for the parents numbPointsParent=rpois(1,areaTotalExt*lambdaParent);#Poisson number of points #x and y coordinates of Poisson points for the parent xxParent=xMinExt+xDeltaExt*runif(numbPointsParent); yyParent=yMinExt+yDeltaExt*runif(numbPointsParent); #Simulate Poisson point process for the daughters (ie final poiint process) numbPointsDaughter=rpois(numbPointsParent,lambdaDaughter); numbPoints=sum(numbPointsDaughter); #total number of points #Generate the (relative) locations in Cartesian coordinates by #simulating independent normal variables xx0=rnorm(numbPoints,0,sigma); yy0=rnorm(numbPoints,0,sigma); #replicate parent points (ie centres of disks/clusters) xx=rep(xxParent,numbPointsDaughter); yy=rep(yyParent,numbPointsDaughter); #translate points (ie parents points are the centres of cluster disks) xx=xx+xx0; yy=yy+yy0; #thin points if outside the simulation window booleInside=((xx&amp;amp;amp;amp;amp;gt;=xMin)&amp;amp;amp;amp;amp;amp;(xx&amp;amp;amp;amp;amp;lt;=xMax)&amp;amp;amp;amp;amp;amp;(yy&amp;amp;amp;amp;amp;gt;=yMin)&amp;amp;amp;amp;amp;amp;(yy&amp;amp;amp;amp;amp;lt;=yMax)); #retain points inside simulation window xx=xx[booleInside]; yy=yy[booleInside]; #Plotting par(pty="s") plot(xx,yy,'p',xlab='x',ylab='y',col='blue'); 

Of course, as I have mentioned before, simulating a spatial point processes in R is even easier with the powerful spatial statistics library spatstat. The Thomas cluster point process is simulated by using the function rThomas, but other cluster point processes, including Neyman-Scott types, are possible.

Python

Note: in previous posts I used the SciPy functions for random number generation, but now use the NumPy ones, but there is little difference, as SciPy builds off NumPy.

 import numpy as np;&amp;amp;amp;amp;amp;nbsp; # NumPy package for arrays, random number generation, etc import matplotlib.pyplot as plt&amp;amp;amp;amp;amp;nbsp; # For plotting # Simulation window parameters xMin = -.5; xMax = .5; yMin = -.5; yMax = .5; # Parameters for the parent and daughter point processes lambdaParent = 10; # density of parent Poisson point process lambdaDaughter = 100; # mean number of points in each cluster sigma = 0.05; # sigma for normal variables (ie random locations) of daughters #Extended simulation windows parameters rExt=7*sigma; #extension parameter #for rExt, use factor of deviation sigma eg 6 or 7 xMinExt = xMin - rExt; xMaxExt = xMax + rExt; yMinExt = yMin - rExt; yMaxExt = yMax + rExt; # rectangle dimensions xDeltaExt = xMaxExt - xMinExt; yDeltaExt = yMaxExt - yMinExt; areaTotalExt = xDeltaExt * yDeltaExt; # area of extended rectangle # Simulate Poisson point process for the parents numbPointsParent = np.random.poisson(areaTotalExt * lambdaParent);# Poisson number of points # x and y coordinates of Poisson points for the parent xxParent = xMinExt + xDeltaExt * np.random.uniform(0, 1, numbPointsParent); yyParent = yMinExt + yDeltaExt * np.random.uniform(0, 1, numbPointsParent); # Simulate Poisson point process for the daughters (ie final poiint process) numbPointsDaughter = np.random.poisson(lambdaDaughter, numbPointsParent); numbPoints = sum(numbPointsDaughter); # total number of points # Generate the (relative) locations in Cartesian coordinates by # simulating independent normal variables xx0 = np.random.normal(0, sigma, numbPoints); # (relative) x coordinaets yy0 = np.random.normal(0, sigma, numbPoints); # (relative) y coordinates # replicate parent points (ie centres of disks/clusters) xx = np.repeat(xxParent, numbPointsDaughter); yy = np.repeat(yyParent, numbPointsDaughter); # translate points (ie parents points are the centres of cluster disks) xx = xx + xx0; yy = yy + yy0; # thin points if outside the simulation window booleInside=((xx&amp;amp;amp;amp;amp;gt;=xMin)&amp;amp;amp;amp;amp;amp;(xx&amp;amp;amp;amp;amp;lt;=xMax)&amp;amp;amp;amp;amp;amp;(yy&amp;amp;amp;amp;amp;gt;=yMin)&amp;amp;amp;amp;amp;amp;(yy&amp;amp;amp;amp;amp;lt;=yMax)); # retain points inside simulation window xx = xx[booleInside]; yy = yy[booleInside]; # Plotting plt.scatter(xx, yy, edgecolor='b', facecolor='none', alpha=0.5); plt.xlabel("x"); plt.ylabel("y"); plt.axis('equal'); 
Julia 

After writing this post, I later wrote the code in Julia. The code is here and my thoughts about Julia are here.

Results

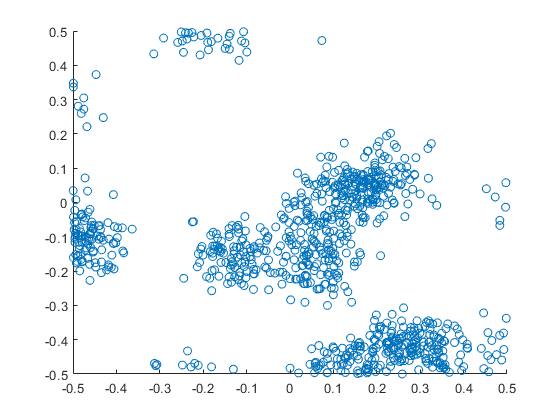
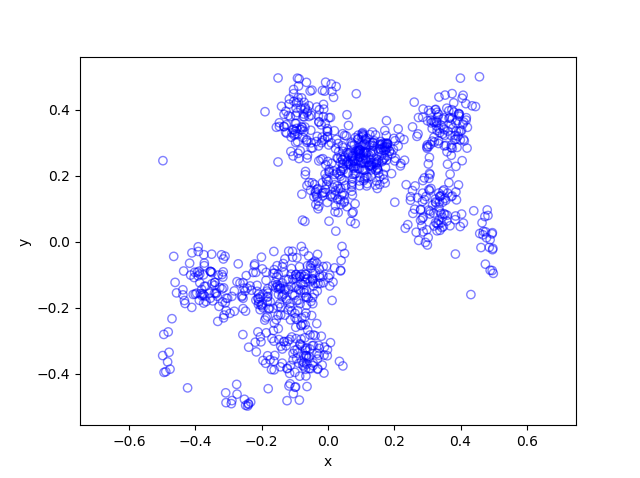
The results show that the clusters of Thomas point process tend to be more blurred than those of Matérn point process, which has cluster edges clearly defined by the disks.  The points of of a Thomas point process can be far away from the centre of each cluster, depending on the variance of the normal random variables used in the simulation. 

MATLAB
R
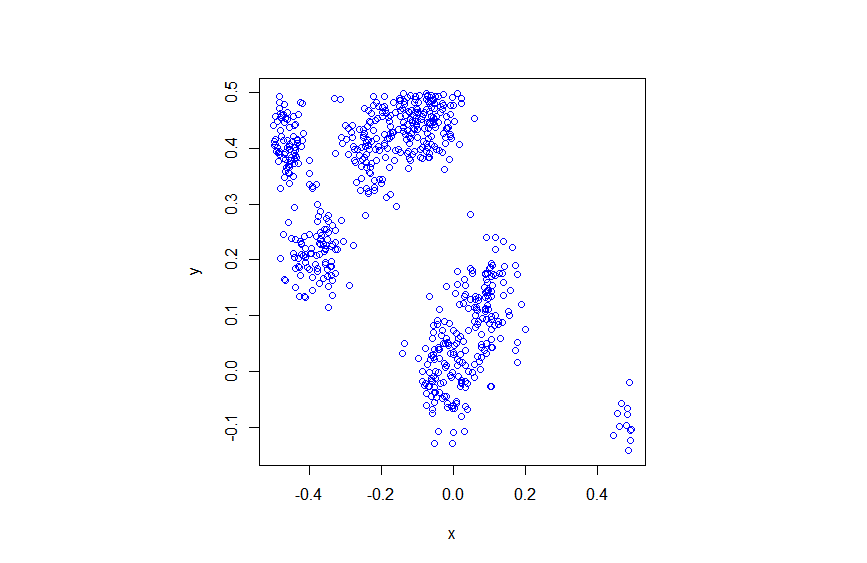
Python
Further reading

Thomas (and Matérn) cluster point processes and more generally Neyman-Scott point processes are covered in standard books on the related fields of spatial statistics, point processes and stochastic geometry, such as the following: Spatial Point Patterns: Methodology and Applications with R by  Baddeley, Rubak and Turner, on page 461; Statistical Analysis and Modelling of Spatial Point Patterns Statistics by Illian, Penttinen, Stoyan, amd Stoyan, page 370 and Section 6.3.2; Stochastic Geometry and its Applications by Chiu, Stoyan, Kendall and Mecke,  on page 173; and; Statistical Inference and Simulation for Spatial Point Processes by Møller and Waagepetersen, in Section 5.3. I would probably recommend the first two books for beginners. 

The Thomas point process has also appeared in models of wireless networks, which we covered in the book Stochastic Geometry Analysis of Cellular Networks by Błaszczyszyn, Haenggi, Keeler, and Mukherjee, Section 8.1.8.

More generally, Neyman-Scott point processes belong to a family of point processes called shot noise Cox point processes; see the paper by Møller. 

I mentioned above the book Spatial Point Patterns: Methodology and Applications with R , which is written by spatial statistics experts Baddeley, Rubak and Turner. It covers the spatial statistics (and point process simulation) R-package spatstat.

In my travels on the web, I found this post where the writer also simulates the Thomas and Matérn point processes in Python, independent of my code.  That code is a bit different to mine because I use the repeat function and simulate all the Poisson variables at once, instead of using a for-loop and simulating a Poisson variable for each iteration.  I also think it’s not quite correct because I do not see how they account for edge effects.