Simulating a Poisson point process on a circle

In this post, I’ll take a break from the more theoretical posts. Instead I’ll describe how to simulate or sample a homogeneous Poisson point process on a circle.  I have already simulated this point process on a rectangle, triangle and disk. In some sense, I should have done this simulation method before the disk one, as it’s easier to simulate. I recommend reading that post first, as the material presented here builds off it.

Sampling a homogeneous Poisson point process on a circle is rather straightforward.  It just requires using a fixed radius and uniformly choose angles from interval \((0, 2\pi)\). But the circle setting gives an opportunity to employ a different method for positioning points uniformly on circles and, more generally, spheres. This approach uses Gaussian random variables, and it becomes much more efficient when the points are placed on high dimensional spheres.

Steps

Simulating a Poisson point process requires two steps: simulating the random number of points and then randomly positioning each point.

Number of points

The number of points of a Poisson point process on circle of radius \(r>0\) is a Poisson random variable with mean \(\lambda C\), where \(C=2\pi r\) is the circumference of the circle.  You just need to be able to need to produce (pseudo-)random numbers according to a Poisson distribution.

To generate Poisson variables in MATLAB,  use the poissrnd function with the argument \(\lambda C\).  In Python, use either the scipy.stats.poisson or numpy.random.poisson function from the SciPy or NumPy libraries. (If you’re curious how Poisson simulation works, I suggest seeing this post for details on sampling Poisson random variables or, more accurately, variates.)

Locations of points

For a homogeneous Poisson point process, we need to uniformly position points on the underlying space, which is this case is a circle. We will look at two different ways to position points uniformly on a circle. The first is arguably the most natural approach.

Method 1: Polar coordinates

We use polar coordinates due to the nature of the problem. To position all the points uniformly on a circle, we simple generate uniform numbers on the unit interval \((0,1)\). We then multiply these random numbers by \(2\pi\).

We have generated polar coordinates for points uniformly located on the circle. To plot the points, we have to convert the coordinates back to Cartesian form by using the change of coordinates:  \(x=\rho\cos(\theta)\) and \(y=\rho\sin(\theta)\).

Method 2: Normal random variables

For each point, we generate two standard normal or Gaussian random variables, say, \(W_x\) and \(W_y\), which are independent of each other. (The term standard here means the normal random variables have mean \(\mu =0\) and standard deviation \(\sigma=1\).) These two random variables are the Cartesian components of a random point.  We then rescale the two values by the Euclidean norm, giving

$$X=\frac{W_x}{(W_x^2+W_y^2)^{1/2}},$$

$$Y=\frac{W_y}{(W_x^2+W_y^2)^{1/2}}.$$

These are the Cartesian coordinates of points uniformly scattered around a unit circle with centre at the origin. We multiply the two random values \(X\) and \(Y\) by the \(r>0\)  for a circle with radius \(r\).

How does it work?

The procedure is somewhat like the Box-Muller transform in reverse. I’ll give an outline of the proof. The joint density of the random variables \(W_x\) and \(W_y\) is that of the bivariate normal distribution with zero correlation, meaning it has the joint density

$$ f(x,y)=\frac{1}{2\pi}e^{[-(x^2+y^2)/2]}.$$

We see that the function \(f\) is a constant when we trace around any line for which \((x^2+y^2)\) is a constant, which is simply the Cartesian equation for a circle (where the radius is the square root of the aforementioned constant). This means that the angle of the point \((W_x, W_y)\) will be uniformly distributed.

Now we just need to look at the distance of the random point. The vector formed from the pair of normal variables \((W_x, W_y)\) is a Rayleigh random variable.  We can see that the vector from the origin to the point \((X,Y)\) has length one, because we rescaled it with the Euclidean norm.

Results

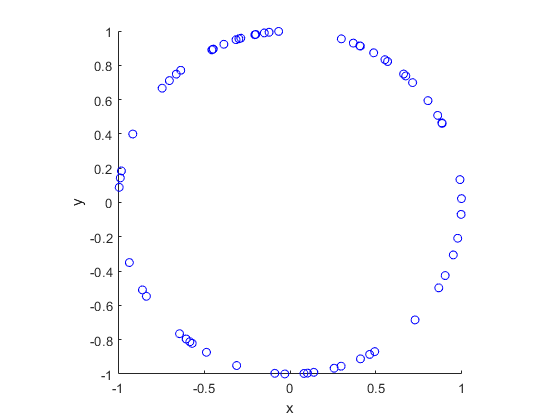
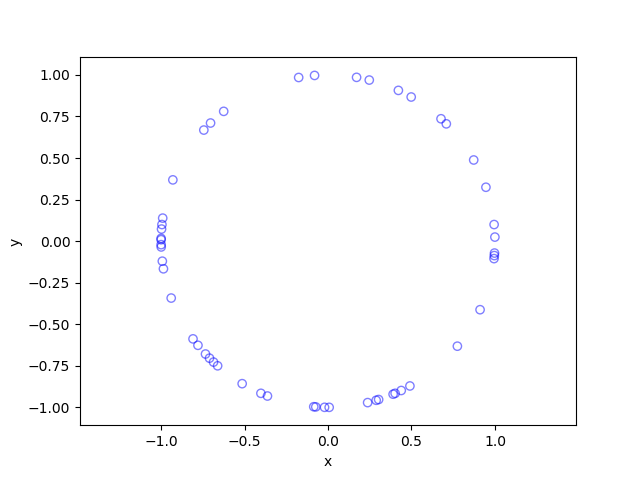
I have presented some results produced by code written in MATLAB and Python. The blue points are the Poisson points on the sphere. I have used a surface plot (with clear faces) in black to illustrate the underling sphere.

MATLAB
Python
Code

The code for all my posts is located online here. For this post, the code in MATLAB and Python is here.

Further reading

I recommend this blog post, which discusses different methods for randomly placing points on spheres and inside spheres (or, rather, balls) in a uniform manner.  (Embedded in two dimensions, a sphere is a circle and a ball is a disk.) A key paper on using normal variables is the following:

  • 1959, Muller, A note on a method for generating points uniformly on n-dimensional spheres.

As I mentioned in the post on the disk, the third edition of the classic book Stochastic Geometry and its Applications by Chiu, Stoyan, Kendall and Mecke details on page 54 how to uniformly place points on a disk.  It just requires a small modification for the circle.

Spiking neural networks

To say that artificial neural networks are having their day in the sun is an understatement. Commonly called just neural networks, you can’t glance at a news source without seeing some reference to artificial intelligence (AI), a term that has become synonymous with the statistical models known as artificial neural networks.

(I hasten to add that neural networks and artificial intelligence are distinct things.  Originally, the latter was a target, in the same way that 5G is a target for telecommunications, which you can reach using whichever means that allow you. Someone may say they are using artificial intelligence, but the models in use may be other statistical or machine learning models, of which there are plenty. At any rate, it now seems artificial neural networks are ahead of the pack.)

From performing language and image tasks to generating and composing artistic (or stochastic?) works, neural networks are impressive in what they can do.

But can these statistical models be better? And so they really work like the brain?

Brain-lite neural networks

Artificial neural networks, dreamt up in the 1940s and 1950s, were inspired by how brains work. But they only grew inspiration from the firing of neurons in brains. These statistical models behave differently to the grey matter that forms our brains. And we can see that by how differently they perform in terms of learning speed and energy usage.

Artificial neural networks require a lot of material to learn anything. The amount of data that is needed to teach or train a state-of-the artificial neural network to learn, say, basic natural language skills is equivalent to a human spending thousands of years being exposed to language. Clearly we are the faster learners.

These statistical models also consume vast amounts of energy for training and running. Our brains just fire along, doing incredibly impressive and diverse things day after day, while using energy at a rate too low to boil a cup of water.

So the question arises: Why don’t we make artificial neural networks more like our brains? Well, historically, the short answer is that these statistical models are nice.

What’s nice about artificial neural networks?

Typically artificial neural networks are specifically built to have two convenient properties. Linearity and continuity.

Linearity

Mathematically, linearity is great because it means you can pull things apart, do stuff, and then put it together without losing or gaining anything. In short, things add up. Matrices are linear operators, and neural networks are essentially just a series of very large matrices coupled together.

Continuity

Continuity is also a wonderfully tractable property. It means that if you adjust  something slightly, then the degree of change will be limited, well, continuous. There will be no jumps or gaps. Things will run smoothly. That means you can find gradients (or derivatives) of these models by performing, say, backpropagation. And that in turn allows the use of optimization functions, which often use gradients to take educated gaps in which way to walk to find maximum or minimum points of continuous functions.

How neurons fire

In the brains, neurons do fire not continuously, but in so-called spikes. In other words, the electrical currents coursing through brain neurons are not steady flow, but consist of series of current spikes. So we see that any continuity assumption in any model of the brain does not reflect reality.

The electrical workings of neurons have motivated researchers to propose  mathematical models for describing the flow of currents in the brain. One historically significant model is the Hodgkin-Huxeley model, whose proposal led to its developers to share the Nobel Prize in Medicine. This model gives us a not-so-nice nonlinear set of differential equations, which you may encounter in a course on solving such differential equations numerically.

The Hodgkin-Huxeley model is a complex model, perhaps needlessly complex in certain cases. Consequently, recalling the law of parsimony in statistics (which artificial neural networks routinely laugh at), researchers, often use other simpler models, such as the leaky integrate-and-fire model.

Brain-heavy neural networks

A relatively small number of researchers are working away at creating neural networks that more closely resemble brains. Much of these models hinge upon using spikes, giving rise to statistical models called spiking neural networks.

These neural networks are, strictly speaking, still artificial, being closely related to recurrent neural networks, a popular type of artificial neural network. But the aim is that these statistical models more closely resemble how brains do their magic.

Where are they?

The big problem of spiking neural networks is training (or fitting) them. The inherent lack of continuity in these networks means you can’t use your favourite gradient-based methods.  Unlike regular network models, that means you can’t do the forward pass, collecting key values along the way, and then do the backward pass, yielding the gradients.

In lieu of this, researchers have proposed other methods, such as approximating the discontinuous functions in spiking neural networks with continuous ones, but then you can find the gradients of these functions, giving you surrogate derivatives, and use them to train the model.

It sounds not quite legit. Using one function to infer something about another function. But some papers seems to suggest there is promise in this approach.

Still, spiking neural networks are a long way from the fame that their continuous cousins enjoy.

Software and hardware

So far I have only covered the model or theory aspects of this statistical model seeking to replicate the brain’s performance. You can liken that to just talking about the software. That’s my leaning, but idea of creating more brainy neural networks has led to hardware too.

Some companies, such as Intel, are now designing and manufacturing computer processors or chips that seek to mimic how the brain works. But the challenge remains in reconciling software and hardware. That’s because proposed software methods may not be suitable for hardware being designed and made.

Further reading

There are some survey papers on this topic, including:

Update: Here’s a more recent survey paper: