Determinantal learning for selecting subsets in wireless networks

We can’t all talk all the time, while still being heard. That’s true for people and it’s true for wireless networks.

Networks need to schedule when their network nodes can transmit and receive data. In other words, a collection or subset of network nodes is chosen to transmit, while another subset is chosen to receive. (In telecommunication language, this is part of what is called the medium access control or MAC layer.)

The classic scheduler (spatial) Aloha involves each node flipping a biased coin with probability \(p\) of heads occurring. If heads comes up, a node can transmit. If not, it must stand ready to receive data. Simple.

But can we do better?

Determinantal scheduling

A few years ago, a couple collaborators and I become interested in this problem. To develop an intelligent (or, at least, not stupid) scheduler, we adapted a machine (or statistical) learning framework and published the results in a conference paper:

  • 2020 – Błaszczyszyn, Brochard, and Keeler, Coverage probability in wireless networks with determinantal scheduling.

The hint is in the title. Using a determinantal scheduler, we derived mathematical expressions for the coverage probability. I discussed that paper in an earlier post. I produced the numerical results with code located here and here.

From fermions to generative model

We used a learning framework based on determinantal point process, which were originally used to model subatomic particles called fermions such as electrons. A key property is that determinantal points, like fermions, repel each other, so this is a random model for diversity, anti-clustering or negative correlations.

Defined with a kernel matrix and determinants, these random models have convenient mathematical properties. For example, you can both simulate them (exactly) and train (or fit) them with maximum likelihood methods. Using this fermion model, Kulesa and Taskar proposed and pioneered a machine learning framework.

When properly trained (or fitted), determinantal models can act as generative artificial intelligence (or Gen AI) models. In some sense, these point processes are special types of Gibbsian point processes, which are defined with a general energy function called a Hamiltonian. In the field of AI and computer science more broadly, there are many energy-based models, some of which are used for generative models such as Boltzmann machines.

Recent work

A few days ago I was curious what was happening in this research area, and by chance, I noticed this recently uploaded preprint:

  • 2025 – Tu, Saha, and Dhillon –  Determinantal Learning for Subset Selection in Wireless Networks.

I feel more work remains to be done in this area.

Further reading

Wireless networks

Our work was inspired by an earlier paper that we did:

    • 2019 – Błaszczyszyn and Keeler, Determinantal thinning of point processes with network learning applications.

In that paper, which I mentioned in an earlier post, we discussed the potential of using determinantal point processes for scheduling network transmission (or selecting subsets). We pointed out that such a model could be trained on optimized network configurations.

The new work by Tu, Saha, and Dhillon is based on previous work, such as this ambitiously-titled paper:

  • 2019 – Saha and Dhillon – Machine Learning meets Stochastic Geometry: Determinantal Subset Selection for Wireless Networks.

This work by Saha and Dhillon work was independent of our work on scheduling, but came out around the same time.

Machine learning

I should stress that none of the above work was possible without the pioneering efforts by Kulesza and Taskar in a series of papers, much of which appears in their book:

  • 2012 – Kulesza and Taskar – Determinantal point processes for machine learning, Now Publishers.

You can find a version of the book here.

News: Accelerated PyTorch learning on Mac

The PyTorch website reveals that I can now do accelerated model training with PyTorch on my Mac (which has one of the new Silicon M series chips):

In collaboration with the Metal engineering team at Apple, we are excited to announce support for GPU-accelerated PyTorch training on Mac. Until now, PyTorch training on Mac only leveraged the CPU, but with the upcoming PyTorch v1.12 release, developers and researchers can take advantage of Apple silicon GPUs for significantly faster model training. This unlocks the ability to perform machine learning workflows like prototyping and fine-tuning locally, right on Mac.

As the website says, this new PyTorch acceleration capability is due to Metal, which is Apple’s graphics processing (or GPU) technology.

This means I no longer need to use remote machines when training models. I can do it all on my trusty home computer. Let’s check.

The easiest way to check is, if you haven’t already, first install PyTorch. I would use Anaconda:

conda install pytorch torchvision -c pytorch

With PyTorch installed, run Python and then run the commands:

import torch
print(torch.backends.mps.is_available()) 
print(torch.backends.mps.is_built())

If the last commands works without a hitch, you have PyTorch installed. The last two commands should return True, meaning that PyTorch can use your graphics card for (accelerated) calculations.

New link: Dataflowr – Deep Learning DIY

Want to learn some deep learning? I recommend the Dataflowr website:

https://dataflowr.github.io/website/

It’s a good resource for learning the basics of neural networks using the PyTorch library in Python. The focus is on writing and running code. You can even play around with  GPUs (graphical processing units) by running them on Google’s Colab, though that’s usually not needed.

It’s mostly run by a researcher who is a former colleague of mine and, while I was at Inria, was indirectly the reason I started using PyTorch for my machine learning work.

Sparse Spiking Gradient Descent

A preprint caught my eye:

  • 2022 – Perez-Nieves and Goodman – Sparse Spiking Gradient Descent.

I love myself a short title. But you wouldn’t guess from the title that the paper is about artificial neural networks. But not just any type of neural network. Here’s the abstract:

There is an increasing interest in emulating Spiking Neural Networks (SNNs) on neuromorphic computing devices due to their low energy consumption. Recent advances have allowed training SNNs to a point where they start to compete with traditional Artificial Neural Networks (ANNs) in terms of accuracy, while at the same time being energy efficient when run on neuromorphic hardware. However, the process of training SNNs is still based on dense tensor operations originally developed for ANNs which do not leverage the spatiotemporally sparse nature of SNNs. We present here the first sparse SNN backpropagation algorithm which achieves the same or better accuracy as current state of the art methods while being significantly faster and more memory efficient. We show the effectiveness of our method on real datasets of varying complexity (Fashion-MNIST, Neuromophic-MNIST and Spiking Heidelberg Digits) achieving a speedup in the backward pass of up to 150x, and 85% more memory efficient, without losing accuracy.

OK. I’ll bite. So what’s a spiking neural network? And why should we care?

Improving on artificial neural networks

Artificial neural networks get all the glory. They are now everywhere. You can’t open up a newspaper or your laptop without seeing a reference to or being pestered by some agent of artificial intelligence (AI), which usually implies an artificial neural network is working in the background. Despite this, they are far from ideal.

In in some sense, mainstream artificial networks networks are rather brain-lite, as they only draw inspiration from how brains actually function. These statistical models are mostly linear and continuous, which makes them well-behaved mathematically (or algorithmically) speaking.

But in terms of energy and time required for training and using computational tools, the carbon-based grey matter is winning. Kids don’t need to read every book, newspaper and sonnet ever written to master a language. While understanding these words, our brains aren’t boiling volumes of water in excess heat output.

To make such statistical models more brain-heavy, researchers have proposed neural networks that run on spikes, drawing inspiration from the spiky electrical jolts that run through brain neurons. The proposal is something called a spiking neural network, which is also artificial neural networks, but they run on spikes with the aim of being more efficient at learning and doing tasks.

Spiking neural networks are not smooth

The problem is that these spiky models are hard to train (or fit), as their nice behaving property of smoothness vanishes when there’s no continuity. You cannot simply run the forward pass and then backward pass to find the gradients of your neural network model, as you do with regular neural networks when doing backpropagation.

Surrogate gradients

Despite this obstacle, there have been some proposals for training these statistical models.  The training proposals often come down to proposing a continuous function to approximate the actual function being used in the spiking neural networks. The function’s gradients are found using standard methods. We can then use these surrogate gradients to infer in which direction we should move to to better train (or fit) the model.

I know. It sounds like cheating, using one function to guess something about another function. But there has been some success with this approach.

Sparse Spiking Gradients

The training method proposed by Perez-Nieves and Goodman is a type of surrogate method. Using the leaky integrate-and-fire (LIF) model for neuron firing, they develop an approximation for the gradients of their spiking neural network. A key feature of their approach is that, much like our brains, their model is sparse in the sense only a small fraction of neurons are every firing.

Provided the spiking neural network attains a certain degree of sparsity, their sparse spiking gradient descent gives faster, less memory-hungry results.

Perez-Nieves and Goodman support their claims by giving numerical results, which they obtained by running their method on graphical processing units (GPUs). These ferociously fast video game chips have become the standard hardware for doing big number-crunching tasks that are routinely required of working with models in machine learning and artificial intelligence.

Spiking neural networks

To say that artificial neural networks are having their day in the sun is an understatement. Commonly called just neural networks, you can’t glance at a news source without seeing some reference to artificial intelligence (AI), a term that has become synonymous with the statistical models known as artificial neural networks.

(I hasten to add that neural networks and artificial intelligence are distinct things.  Originally, the latter was a target, in the same way that 5G is a target for telecommunications, which you can reach using whichever means that allow you. Someone may say they are using artificial intelligence, but the models in use may be other statistical or machine learning models, of which there are plenty. At any rate, it now seems artificial neural networks are ahead of the pack.)

From performing language and image tasks to generating and composing artistic (or stochastic?) works, neural networks are impressive in what they can do.

But can these statistical models be better? And so they really work like the brain?

Brain-lite neural networks

Artificial neural networks, dreamt up in the 1940s and 1950s, were inspired by how brains work. But they only grew inspiration from the firing of neurons in brains. These statistical models behave differently to the grey matter that forms our brains. And we can see that by how differently they perform in terms of learning speed and energy usage.

Artificial neural networks require a lot of material to learn anything. The amount of data that is needed to teach or train a state-of-the artificial neural network to learn, say, basic natural language skills is equivalent to a human spending thousands of years being exposed to language. Clearly we are the faster learners.

These statistical models also consume vast amounts of energy for training and running. Our brains just fire along, doing incredibly impressive and diverse things day after day, while using energy at a rate too low to boil a cup of water.

So the question arises: Why don’t we make artificial neural networks more like our brains? Well, historically, the short answer is that these statistical models are nice.

What’s nice about artificial neural networks?

Typically artificial neural networks are specifically built to have two convenient properties. Linearity and continuity.

Linearity

Mathematically, linearity is great because it means you can pull things apart, do stuff, and then put it together without losing or gaining anything. In short, things add up. Matrices are linear operators, and neural networks are essentially just a series of very large matrices coupled together.

Continuity

Continuity is also a wonderfully tractable property. It means that if you adjust  something slightly, then the degree of change will be limited, well, continuous. There will be no jumps or gaps. Things will run smoothly. That means you can find gradients (or derivatives) of these models by performing, say, backpropagation. And that in turn allows the use of optimization functions, which often use gradients to take educated gaps in which way to walk to find maximum or minimum points of continuous functions.

How neurons fire

In the brains, neurons do fire not continuously, but in so-called spikes. In other words, the electrical currents coursing through brain neurons are not steady flow, but consist of series of current spikes. So we see that any continuity assumption in any model of the brain does not reflect reality.

The electrical workings of neurons have motivated researchers to propose  mathematical models for describing the flow of currents in the brain. One historically significant model is the Hodgkin-Huxeley model, whose proposal led to its developers to share the Nobel Prize in Medicine. This model gives us a not-so-nice nonlinear set of differential equations, which you may encounter in a course on solving such differential equations numerically.

The Hodgkin-Huxeley model is a complex model, perhaps needlessly complex in certain cases. Consequently, recalling the law of parsimony in statistics (which artificial neural networks routinely laugh at), researchers, often use other simpler models, such as the leaky integrate-and-fire model.

Brain-heavy neural networks

A relatively small number of researchers are working away at creating neural networks that more closely resemble brains. Much of these models hinge upon using spikes, giving rise to statistical models called spiking neural networks.

These neural networks are, strictly speaking, still artificial, being closely related to recurrent neural networks, a popular type of artificial neural network. But the aim is that these statistical models more closely resemble how brains do their magic.

Where are they?

The big problem of spiking neural networks is training (or fitting) them. The inherent lack of continuity in these networks means you can’t use your favourite gradient-based methods.  Unlike regular network models, that means you can’t do the forward pass, collecting key values along the way, and then do the backward pass, yielding the gradients.

In lieu of this, researchers have proposed other methods, such as approximating the discontinuous functions in spiking neural networks with continuous ones, but then you can find the gradients of these functions, giving you surrogate derivatives, and use them to train the model.

It sounds not quite legit. Using one function to infer something about another function. But some papers seems to suggest there is promise in this approach.

Still, spiking neural networks are a long way from the fame that their continuous cousins enjoy.

Software and hardware

So far I have only covered the model or theory aspects of this statistical model seeking to replicate the brain’s performance. You can liken that to just talking about the software. That’s my leaning, but idea of creating more brainy neural networks has led to hardware too.

Some companies, such as Intel, are now designing and manufacturing computer processors or chips that seek to mimic how the brain works. But the challenge remains in reconciling software and hardware. That’s because proposed software methods may not be suitable for hardware being designed and made.

Further reading

There are some survey papers on this topic, including:

Update: Here’s a more recent survey paper:

Coverage probability in wireless networks with determinantal scheduling

My collaborators and I uploaded a manuscript:

  • Błaszczyszyn, Brochard, and Keeler, Coverage probability in wireless networks with determinantal scheduling.

https://arxiv.org/abs/2006.05038

Details

The paper builds off some previous work by us that uses a (relatively) new model in machine learning:

  • Błaszczyszyn and Keeler, Determinantal thinning of point processes with network learning applications.

https://arxiv.org/abs/1810.08672

The new machine learning model is based on a special type of point process called a determinantal point process. It was originally called a Fermion point process. These are useful point processes as the exhibit certain closure properties under certain operations such independent thinning.

Determinantal point processes are random objects and, when they are properly trained or fitted, can serve as generative artificial intelligence (or Gen AI) models. In fact, you can interpret these point processes as a special Gibbsian point processes, which have at their core a Hamiltonian function. A Hamiltonian is generalized type of energy function, which is also the basis for other generative (or stochastic) models such as Boltzmann machines.

Kulesza and Taskar introduced and developed the framework for using determinantal point processes for machine learning models.

Code

The MATLAB code for the producing the results in the paper can be found here:

https://github.com/hpaulkeeler/detcov_matlab

I also re-wrote the MATLAB code into Python:

https://github.com/hpaulkeeler/detcov_python

Further reading

Our work started with this related paper:

  • Błaszczyszyn and Keeler, Determinantal thinning of point processes with network learning applications.

I wrote about this work briefly in an earlier post.

Parallel (or orthogonal, perhaps) to our work, is this paper:

  • 2019 – Saha and Dhillon – Machine Learning meets Stochastic Geometry: Determinantal Subset Selection for Wireless Networks.

https://arxiv.org/abs/1905.00504

Update: A manuscript extending the above line of research by Saha and Dhillon was uploaded:

  • 2025 – Tu, Saha and Dhillon – Determinantal Learning for Subset Selection in Wireless Networks.

https://arxiv.org/abs/2503.03151

Creating a simple feedforward neural network (without using libraries)

Deep learning refers several classes of statistical models, most often neural networks, which are deep in the sense that they have many layers between the input and output. We can think of these layers as computational stages.

(More precisely, you can think of them as very big matrices.)

These statistical models have now become interchangeable with the much loved term artificial intelligence (AI). But how do neural networks work?

Neural networks are collections of large — often extraordinarily large — matrices with values that have been carefully chosen (or found) so that running inputs through these matrices generates accurate outputs for certain problems like classifying photos or writing readable sentences. There are many types of neural networks, but to understand them, it’s best to start with a basic one, which is an approach I covered in a previous post.

Without using any of the neural network libraries in MATLAB or Python (of which there are several), I wrote a simple four-layer feedforward (neural) network, which is also called a multilayer perceptron. This is an unadorned neural network without any of the fancy bells and whistles that they now possess.

And that’s all you need to understand the general gist of deep learning.

Binary classification problem

I applied the simple neural network to the classic problem of binary classification. More specifically, I created a simple problem by divided two-dimensional (Cartesian) square into two non-overlapping regions. My neural network needs to identify in region a point lies in a square. A simple problem, but it is both fundamental and challenging.

I created three such problems with increasing difficulty. Here they are:

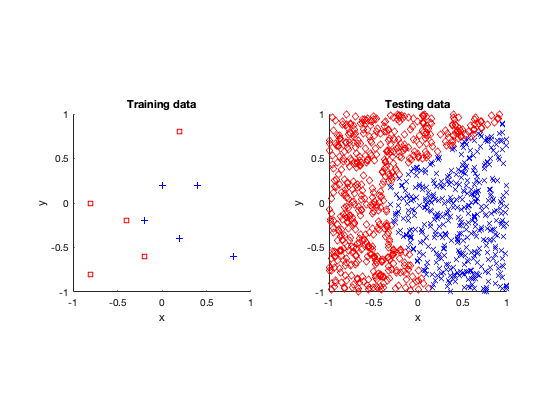
  1. Simple: Ten points of two types located in a square, where the classification border  between the two types is curve lined.
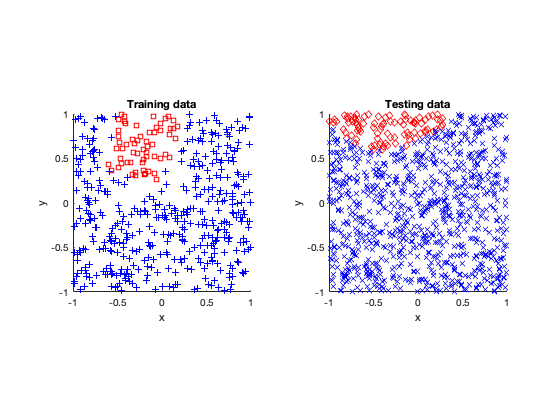
  2. Voronoi: A Voronoi tessellation is (deterministically) created with a small number of seeds (or Voronoi cells). A point can either be in a given Voronoi cell or not, hence there are two types of points.
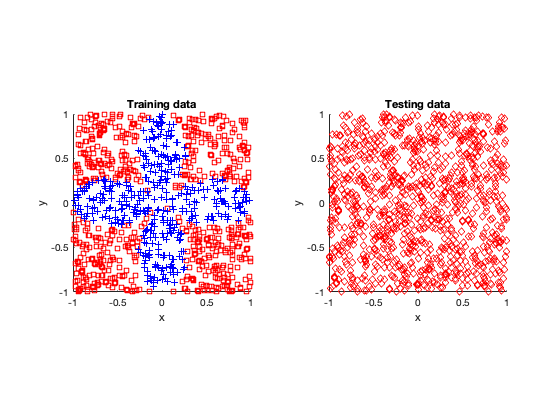
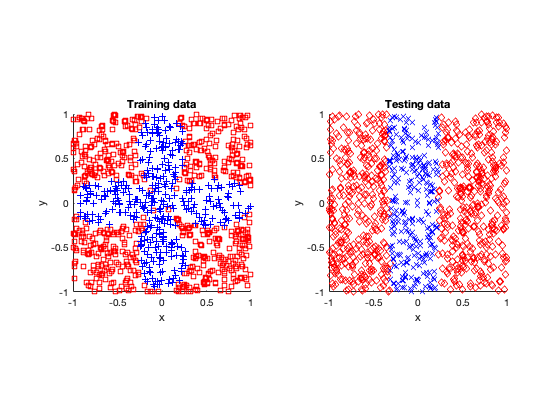
  3. Rose: A simple diagram of a four-petal flower or rose is created using a polar coordinates. Located entirely inside a square, points can either be inside the rose or not, giving two types of points.

Components of the neural network model

Optimization method

I fitted or or trained my four-layer neural network model by using a simple stochastic gradient descent method. The field of optimization (or operations research) abounds with methods based on gradients (or derivatives), which usually fall under the category of convex optimziation.

In the code I wrote,  a random coordinate is chosen, and then the fitting (or optimization) method takes a step where the gradient is the largest, where the size of step is dictated by a fixed constant called a learning rate. This procedure is repeated for some pre-fixed number of steps. The random choosing of the coordinate is done with replacement.

This is basically the simplest training method you can use. In practice, you never use such simple methods, relying upon more complex gradient-based methods such as Adam.

Cost function

For training, the so-called cost function or loss function is a root-mean-square function,1Or \(L^2\) norm. which goes against the flow today, as most neural networks now employ cost functions based on the maximum likelihood and cross-entropy. There is a good reason why these are used instead of the root-mean-square. They work much better.

Activation function

For the activation function, the code uses the sigmoid function, but you can easily change it to use recitified linear unit (ReLU), which is what most neural networks use today. For decades, it commonly accepted to use the sigmoid function, partly because it’s smooth. But it seems only work well for small networks. The rectified linear unit reigns supreme now, as it is considerably better than the sigmoid function and others in large neural networks.

Code

I stress that this code is only for educational purposes. It’s designed to gain intuition into how (simple) neural networks do what they do.

If you have a problem that requires neural networks (or deep learning), then use one of the libraries such as PyTorch or TensorFlow. Do not use my code for such problems.

I generally found that the MATLAB code run much faster and smoother than the Python code. Python isn’t great for speed. (Serious libraries are not written in Python but C or, like much of the matrix libraries in Python, Fortran.)

Here’s my code.

MATLAB

% This code runs a simple feedforward neural network inspired.
%
% The neural network is a multi-layer perceptron designed for a simple
% binary classification. The classification is determining whether a
% two-dimensional (Cartesian) point is located inside some given region or
% not.
%
% For the simple binary examples used here, the code seems to work for
% sufficiently large number of optimization steps, typically in the 10s and
% 100s of thousands.
%
% This neural network only has 4 layers (so 2 hidden layers). The
% trainning procedure, meaning the forward and backward passes, are
% hard-coded. This means changing the number of layers requires additional
% information on the neural network architecture.
%
% It uses the sigmoid function; see the activate function.
%
% NOTE: This code is for illustration and educational purposes only. Use a
% industry-level library for real problems.
%
% Author: H. Paul Keeler, 2019.
% Website: hpaulkeeler.com
% Repository: github.com/hpaulkeeler/posts

clearvars; clc; close all;

choiceData=3; %choose 1, 2 or 3
numbSteps = 2e5; %number of steps for the (gradient) optimization method
rateLearn = 0.05; %hyperparameter
numbTest = 1000; %number of points for testing the fitted model
boolePlot=true;

rng(42); %set seed for reproducibility of results

%generating or retrieving the training data
switch choiceData
    case 1
        %%% simple example
        %recommended minimum number of optimization steps: numbSteps = 1e5
        x1 = 2*[0.1,0.3,0.1,0.6,0.4,0.6,0.5,0.9,0.4,0.7]-1;
        x2 = 2*[0.1,0.4,0.5,0.9,0.2,0.3,0.6,0.2,0.4,0.6]-1;
        numbTrainAll = 10; %number of training data
        %output (binary) data
        y = [ones(1,5) zeros(1,5); zeros(1,5) ones(1,5)];
    case 2
        %%% voronoi example
        %recommended minimum number of optimization steps: numbSteps = 1e5
        numbTrainAll = 1000; %number of training data
        x1 = 2*rand(1,numbTrainAll)-1;
        x2=2*rand(1,numbTrainAll)-1;
        booleInsideVoroni=checkVoronoiInside(x1,x2);
        % output (binary) data
        y=[booleInsideVoroni;~booleInsideVoroni];
    case 3
        %%% rose/flower example
        %recommended minimum number of optimization steps: numbSteps = 2e5
        numbTrainAll=1000; %number of training data
        x1=2*rand(1,numbTrainAll)-1;
        x2=2*rand(1,numbTrainAll)-1;
        booleInsideFlower=checkFlowerInside(x1,x2);
        %output (binary) data
        y=[booleInsideFlower;~booleInsideFlower];

end
x=[x1;x2];
booleTrain = logical(y);

%dimensions/widths of neural network
numbWidth1 = 2; %must be 2 for 2-D input data
numbWidth2 = 4;
numbWidth3 = 4;
numbWidth4 = 2; %must be 2 for binary output
numbWidthAll=[numbWidth1,numbWidth2,numbWidth3,numbWidth4];
numbLayer=length(numbWidthAll);

%initialize weights and biases
scaleModel = .5;
W2 = scaleModel * randn(numbWidth2,numbWidth1);
b2 = scaleModel * rand(numbWidth2,1);
W3 = scaleModel * randn(numbWidth3,numbWidth2);
b3 = scaleModel * rand(numbWidth3,1);
W4 = scaleModel * randn(numbWidth4,numbWidth3);
b4 = scaleModel * rand(numbWidth4,1);

%create arrays of matrices
%w matrices
arrayW{1}=W2;
arrayW{2}=W3;
arrayW{3}=W4;
%b vectors
array_b{1}=b2;
array_b{2}=b3;
array_b{3}=b4;
%activation matrices
arrayA=mat2cell(zeros(sum(numbWidthAll),1),numbWidthAll);
%delta (gradient) vectors
array_delta=mat2cell(zeros(sum(numbWidthAll(2:end)),1),numbWidthAll(2:end));

costHistory = zeros(numbSteps,1); %record the cost for each step
for i = 1:numbSteps
    %forward and back propagation
    indexTrain=randi(numbTrainAll);
    xTrain = x(:,indexTrain);

    %run forward pass
    A2 = activate(xTrain,W2,b2);
    A3 = activate(A2,W3,b3);
    A4 = activate(A3,W4,b4);

    %new (replaces above three lines)
    arrayA{1}=xTrain;
    for j=2:numbLayer
        arrayA{j}=activate(arrayA{j-1},arrayW{j-1},array_b{j-1});
    end

    %run backward pass (to calculate the gradient) using Hadamard products
    delta4 = A4.*(1-A4).*(A4-y(:,indexTrain));
    delta3 = A3.*(1-A3).*(transpose(W4)*delta4);
    delta2 = A2.*(1-A2).*(transpose(W3)*delta3);

    %new (replaces above three lines)
    A_temp=arrayA{numbLayer};
    array_delta{numbLayer-1}=A_temp.*(1-A_temp).*(A_temp-y(:,indexTrain));
    for j=numbLayer-1:-1:2
        A_temp=arrayA{j};
        delta_temp=array_delta{j};
        W_temp=arrayW{j};
        array_delta{j-1}= A_temp.*(1-A_temp).*(transpose(W_temp)*delta_temp);
    end

    %update using steepest descent
    %transpose of xTrains used for W matrices
    W2 = W2 - rateLearn*delta2*transpose(xTrain);
    W3 = W3 - rateLearn*delta3*transpose(A2);
    W4 = W4 - rateLearn*delta4*transpose(A3);
    b2 = b2 - rateLearn*delta2;
    b3 = b3 - rateLearn*delta3;
    b4 = b4 - rateLearn*delta4;

    %new (replaces above six lines)
    for j=1:numbLayer-1
        A_temp=arrayA{j};
        delta_temp=array_delta{j};
        arrayW{j}=arrayW{j} - rateLearn*delta_temp*transpose(A_temp);
        array_b{j}=array_b{j} - rateLearn*delta_temp;
    end

    %update cost
    costCurrent_i = getCost(x,y,arrayW,array_b,numbLayer);
    costHistory(i) = costCurrent_i;
end

%generating test data
xTest1 = 2*rand(1,numbTest)-1;
xTest2 = 2*rand(1,numbTest)-1;
xTest = [xTest1;xTest2];
booleTest = (false(2,numbTest));

%testing every point
for k=1:numbTest
    xTestSingle = xTest(:,k);
    %apply fitted model
    yTestSingle = feedForward(xTestSingle,arrayW,array_b,numbLayer);
    [~,indexTest] = max(yTestSingle);

    booleTest(1,k) = (indexTest==1);
    booleTest(2,k) = (indexTest==2);
end

if boolePlot

    %plot history of cost
    figure;
    semilogy(1:numbSteps,costHistory);
    xlabel('Number of optimization steps');
    ylabel('Value of cost function');
    title('History of the cost function')

    %plot training data
    figure;
    tiledlayout(1,2);
    nexttile;
    hold on;
    plot(x1(booleTrain(1,:)),x2(booleTrain(1,:)),'rs');
    plot(x1(booleTrain(2,:)),x2(booleTrain(2,:)),'b+');
    xlabel('x');
    ylabel('y');
    title('Training data');
    axis([-1,1,-1,1]);
    axis square;

    %plot test data

    nexttile;
    hold on;
    plot(xTest1(booleTest(1,:)),xTest2(booleTest(1,:)),'rd');
    plot(xTest1(booleTest(2,:)),xTest2(booleTest(2,:)),'bx');
    xlabel('x');
    ylabel('y');
    title('Testing data');
    axis([-1,1,-1,1]);
    axis square;

end

function costTotal = getCost(x,y,arrayW,array_b,numbLayer)
numbTrainAll = max(size(x));
%originally y, x1 and x2 were defined outside this function
costAll = zeros(numbTrainAll,1);

for i = 1:numbTrainAll
    %loop through every training point
    x_i = x(:,i);

    A_Last=feedForward(x_i,arrayW,array_b,numbLayer);
    %find difference between algorithm output and training data
    costAll(i) = norm(y(:,i) - A_Last,2);
end
costTotal = norm(costAll,2)^2;
end

function y = activate(x,W,b)
z=(W*x+b);
%evaluate sigmoid (ie logistic) function
y = 1./(1+exp(-z));

%evaluate ReLU (rectified linear unit)
%y = max(0,z);
end

function A_Last= feedForward(xSingle,arrayW,array_b,numbLayer)
%run forward pass
A_now=xSingle;
for j=2:numbLayer
    A_next=activate(A_now,arrayW{j-1},array_b{j-1});
    A_now=A_next;
end


A_Last=A_next;
end

function booleFlowerInside=checkFlowerInside(x1,x2)
% This function creates a simple binary classification problem.
% A single point (x1,x2) is either inside a flower petal or not, where the
% flower (or rose) is defined in polar coordinates by the equation:
%
% rho(theta) =cos(k*theta)), where k is a positive integer.

orderFlower = 2;
[thetaFlower, rhoFlower] = cart2pol(x1(:)',x2(:)');
% check if point (x1,x2) is inside the rose
booleFlowerInside = abs(cos(orderFlower*thetaFlower)) <= rhoFlower;

end

function booleVoronoiInside=checkVoronoiInside(x1,x2)
% This function creates a simple binary classification problem.
% A single point (x1,x2) is either inside a chosen Voronoi cell or not,
% where the Voronoi cells are defined deterministically below.

numbPoints = length(x1);
% generat some deterministic seeds for the Voronoi cells
numbSeed = 6;
indexCellChosen = 4; %arbitrary chosen cells from first up to this number

t = 1:numbSeed;
% a deterministic points located on the square [-1,+1]x[-1,+1]
xSeed1 = sin(27*t.*pi.*cos(t.^2*pi+.4)+1.4);
xSeed2 = sin(4.7*t.*pi.*sin(t.^3*pi+.7)+.3);
xSeed = [xSeed1;xSeed2];

% find which Voroinoi cells each point (x1,x2) belongs to
indexVoronoi = zeros(1,numbPoints);
for i = 1:numbPoints
    x_i = [x1(i);x2(i)]; %retrieve single point
    diff_x = xSeed-x_i;
    distSquared_x = diff_x(1,:).^2+diff_x(2,:).^2; %relative distance squared
    [~,indexVoronoiTemp] = min(distSquared_x); %find closest seed
    indexVoronoi(i) = indexVoronoiTemp;
end

% see if points are inside the Voronoi cell number indexCellSingle
booleVoronoiInside = (indexVoronoi==indexCellChosen);
end

Python

The use of matrices in Python are kindly described as an afterthought. So it takes a bit of Python sleight of hand to get MATLAB code translated into working Python code.

(This stems partly from the fact that Python is row-major, as the language it’s built upon, C, whereas MATLAB is column-major, as its inspiration, Fortran.)

# This code runs a simple feedforward neural network.
#
# The neural network is a multi-layer perceptron designed for a simple
# binary classification. The classification is determining whether a
# two-dimensional (Cartesian) point is located inside some given region or
# not.
#
# For the simple binary examples used here, the code seems to work for
# sufficiently large number of optimization steps, typically in the 10s and
# 100s of thousands.
#
# This neural network only has 4 layers (so 2 hidden layers). The
# trainning procedure, meaning the forward and backward passes, are
# hard-coded. This means changing the number of layers requires additional
# information on the neural network architecture.
#
# It uses the sigmoid function; see the activate function.
#
# NOTE: This code is for illustration and educational purposes only. Use a
# industry-level library for real problems.
#
# For more details, see the post:
#
# https://hpaulkeeler.com/creating-a-simple-feedforward-neural-network-without-libraries/
#
# Author: H. Paul Keeler, 2019.
# Website: hpaulkeeler.com
# Repository: github.com/hpaulkeeler/posts

import numpy as np;  # NumPy package for arrays, random number generation, etc
import matplotlib.pyplot as plt  # For plotting
#from FunctionsExamples import checkFlowerInside, checkVoronoiInside

plt.close('all');  # close all figures

choiceData=1; #choose 1, 2 or 3

numbSteps = 1e5; #number of steps for the (gradient) optimization method
rateLearn = 0.05; #hyperparameter
numbTest = 1000; #number of points for testing the fitted model
boolePlot = True;

np.random.seed(42); #set seed for reproducibility of results

#helper functions for generating problems
def checkFlowerInside(x1,x2):
    # This function creates a simple binary classification problem.
    # A single point (x1,x2) is either inside a flower petal or not, where the
    # flower (or rose) is defined in polar coordinates by the equation:
    #
    # rho(theta) =cos(k*theta)), where k is a positive integer.

    orderFlower = 2;
    thetaFlower = np.arctan2(x2,x1);
    rhoFlower = np.sqrt(x1**2+x2**2);
    # check if point (x1,x2) is inside the rose
    booleFlowerInside = np.abs(np.cos(orderFlower*thetaFlower)) <= rhoFlower;
    return booleFlowerInside

def checkVoronoiInside(x1,x2):
    # This function creates a simple binary classification problem.
    # A single point (x1,x2) is either inside a chosen Voronoi cell or not,
    # where the Voronoi cells are defined deterministically below.
    numbPoints = len(x1);
    # generat some deterministic seeds for the Voronoi cells
    numbSeed = 6;
    indexCellChosen = 4; #arbitrary chosen cells from first up to this number

    t = np.arange(numbSeed)+1;
    # a deterministic points located on the square [-1,+1]x[-1,+1]
    xSeed1 = np.sin(27*t*np.pi*np.cos(t**2*np.pi+.4)+1.4);
    xSeed2 = np.sin(4.7*t*np.pi*np.sin(t**3*np.pi+.7)+.3);
    xSeed = np.stack((xSeed1,xSeed2),axis=0);

    # find which Voroinoi cells each point (x1,x2) belongs to
    indexVoronoi = np.zeros(numbPoints);
    for i in range(numbPoints):
        x_i = np.stack((x1[i],x2[i]),axis=0).reshape(-1, 1); #retrieve single point
        diff_x = xSeed-x_i;
        distSquared_x = diff_x[0,:]**2+diff_x[1,:]**2; #relative distance squared
        indexVoronoiTemp = np.argmin(distSquared_x); #find closest seed
        indexVoronoi[i] = indexVoronoiTemp;

    # see if points are inside the Voronoi cell number indexCellSingle
    booleVoronoiInside = (indexVoronoi==indexCellChosen);
    return booleVoronoiInside


#generating or retrieving the training data
if (choiceData==1):
    ### simple example
    #recommended minimum number of optimization steps: numbSteps = 1e5
    x1 = 2*np.array([0.1,0.3,0.1,0.6,0.4,0.6,0.5,0.9,0.4,0.7])-1;
    x2 = 2*np.array([0.1,0.4,0.5,0.9,0.2,0.3,0.6,0.2,0.4,0.6])-1;
    numbTrainAll = 10; #number of training data
    #output (binary) data
    y = np.array([[1,1,1,1,1,0,0,0,0,0],[0,0,0,0,0,1,1,1,1,1]]);

    x=np.stack((x1,x2),axis=0);

if (choiceData==2):
    ### voronoi example
    #recommended minimum number of optimization steps: numbSteps = 1e5
    numbTrainAll = 500; #number of training data
    x=2*np.random.uniform(0, 1,(2,numbTrainAll))-1;
    x1 = x[0,:];
    x2 = x[1,:];
    booleInsideVoroni=checkVoronoiInside(x1,x2);
    # output (binary) data
    y=np.stack((booleInsideVoroni,~booleInsideVoroni),axis=0);

if (choiceData==3):
    ### rose/flower example
    #recommended minimum number of optimization steps: numbSteps = 2e5
    numbTrainAll=100; #number of training data
    x=2*np.random.uniform(0, 1,(2,numbTrainAll))-1;
    x1 = x[0,:];
    x2 = x[1,:];
    booleInsideFlower=checkFlowerInside(x1,x2);
    #output (binary) data
    y=np.stack((booleInsideFlower,~booleInsideFlower),axis=0);

#helper functions for training and running the neural network
def activate(x,W,b):
    z=np.matmul(W,x)+b;
    #evaluate sigmoid (ie logistic) function
    y = 1/(1+np.exp(-z));

    #evaluate ReLU (rectified linear unit)
    #y = np.max(0,z);
    return y

def feedForward(xSingle,arrayW,array_b,numbLayer):
    #run forward pass
    A_now=xSingle;
    for j in np.arange(1,numbLayer):
        A_next=activate(A_now,arrayW[j-1],array_b[j-1]);
        A_now=A_next;
    A_Last=A_next;

    return A_Last;


def getCost(x,y,arrayW,array_b,numbLayer):
    numbTrainAll = np.max(x.shape);
    #originally y, x1 and x2 were defined outside this function
    costAll = np.zeros((numbTrainAll,1));

    for i in range(numbTrainAll):
        #loop through every training point
        x_i = x[:,i].reshape(-1, 1);

        A_Last=feedForward(x_i,arrayW,array_b,numbLayer);
        #find difference between algorithm output and training data
        costAll[i] = np.linalg.norm(y[:,i].reshape(-1, 1) - A_Last,2);

        costTotal = np.linalg.norm(costAll,2)**2;

    return costTotal

#dimensions/widths of neural network
numbWidth1 = 2; #must be 2 for 2-D input data
numbWidth2 = 4;
numbWidth3 = 4;
numbWidth4 = 2; #must be 2 for binary output
numbWidthAll=np.array([numbWidth1,numbWidth2,numbWidth3,numbWidth4]);
numbLayer=len(numbWidthAll);

#initialize weights and biases
scaleModel = .5;
W2 = scaleModel * np.random.normal(0, 1,(numbWidth2,numbWidth1));
b2 = scaleModel * np.random.uniform(0, 1,(numbWidth2,1));
W3 = scaleModel * np.random.normal(0, 1,(numbWidth3,numbWidth2));
b3 = scaleModel * np.random.uniform(0, 1,(numbWidth3,1));
W4 = scaleModel * np.random.normal(0, 1,(numbWidth4,numbWidth3));
b4 = scaleModel * np.random.uniform(0, 1,(numbWidth4,1));

#create lists of matrices
#w matrices
arrayW=[];
arrayW.append(W2);
arrayW.append(W3);
arrayW.append(W4);
#b vectors
array_b=[];
array_b.append(b2);
array_b.append(b3);
array_b.append(b4);
#activation matrices
arrayA=[];
for j in range(numbLayer):
    arrayA.append(np.zeros(numbWidthAll[j]).reshape(-1, 1).T);
#delta (gradient) vectors
array_delta=[];
for j in range(numbLayer-1):
    array_delta.append(np.zeros(numbWidthAll[j+1]).reshape(-1, 1).T);

numbSteps=int(numbSteps)
costHistory = np.zeros((numbSteps,1));
booleTrain = y;
for i in range(numbSteps):
    #forward and back propagation
    indexTrain=np.random.randint(numbTrainAll);
    xTrain = x[:,indexTrain].reshape(-1, 1);

    #run forward pass
    arrayA[0]=xTrain; #treat input as the A1 matrix
    for j in (range(numbLayer-1)):
        arrayA[j+1]=activate(arrayA[j],arrayW[j],array_b[j]);

    #run backward pass (to calculate the gradient) using Hadamard products
    A_temp=arrayA[-1];
    array_delta[-1]=A_temp*(1-A_temp)*(A_temp-y[:,indexTrain].reshape(-1, 1));
    for j in np.arange(numbLayer-2,0,-1):
        A_temp=arrayA[j];
        delta_temp=array_delta[j];
        W_temp=arrayW[j];
        array_delta[j-1]= A_temp*(1-A_temp)*np.matmul(np.transpose(W_temp),delta_temp);


    #update using steepest descent
    #transpose of xTrains used for W matrices
    for j in range(numbLayer-1):
        A_temp=arrayA[j];
        delta_temp=array_delta[j];
        arrayW[j]=arrayW[j] - rateLearn*np.matmul(delta_temp,np.transpose(A_temp));
        array_b[j]=array_b[j] - rateLearn*delta_temp;


    #update cost
    costCurrent_i = getCost(x,y,arrayW,array_b,numbLayer);
    costHistory[i] = costCurrent_i;

#generating test data
xTest = 2*np.random.uniform(0,1,(2,numbTest))-1;
xTest1 = xTest[0,:];
xTest2 = xTest[1,:];

booleTest = np.zeros((2,numbTest));

#testing every point
for k in range(numbTest):
    xTestSingle = xTest[:,k].reshape(-1, 1);
    #apply fitted model
    yTestSingle = feedForward(xTestSingle,arrayW,array_b,numbLayer);
    indexTest = np.argmax(yTestSingle, axis=0);
    booleTest[0,k] = ((indexTest==0)[0]);
    booleTest[1,k] = ((indexTest==1)[0]);

if boolePlot:
    #plot history of cost
    plt.figure();
    plt.semilogy(np.arange(numbSteps)+1,costHistory);
    plt.xlabel('Number of optimization steps');
    plt.ylabel('Value of cost function');
    plt.title('History of the cost function')

    #plot training data
    fig, ax = plt.subplots(1, 2);
    ax[0].plot(x1[np.where(booleTrain[0,:])],x2[np.where(booleTrain[0,:])],\
        'rs', markerfacecolor='none');
    ax[0].plot(x1[np.where(booleTrain[1,:])],x2[np.where(booleTrain[1,:])],\
        'b+');
    ax[0].set_xlabel('x');
    ax[0].set_ylabel('y');
    ax[0].set_title('Training data');
    ax[0].set_xlim([-1, 1])
    ax[0].set_ylim([-1, 1])
    ax[0].axis('equal');

    #plot test data
    ax[1].plot(xTest1[np.where(booleTest[0,:])],xTest2[np.where(booleTest[0,:])],\
        'rd', markerfacecolor='none');
    ax[1].plot(xTest1[np.where(booleTest[1,:])],xTest2[np.where(booleTest[1,:])],\
        'bx');
    ax[1].set_xlabel('x');
    ax[1].set_ylabel('y');
    ax[1].set_title('Testing data');
    ax[1].set_xlim([-1, 1])
    ax[1].set_ylim([-1, 1])
    ax[1].axis('equal');

Results

After fitting or training the models, I tested them by applying the fitted neural network to other data. (In machine learning and statistics, you famously don’t use the same data to train and test a model.)

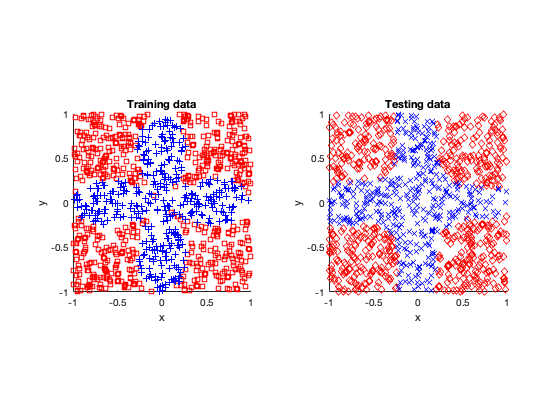
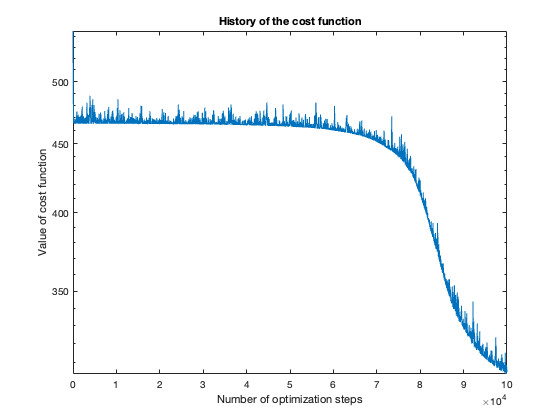
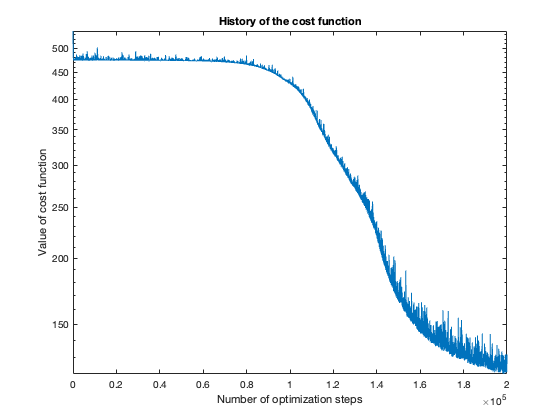
The number of steps needed to obtain reasonable results was about 100 thousand. To get a feeling of this, look at the plot of the cost function value over the number of optimization steps. For more complicated problems, such as the flower or rose problem, even more steps were needed.

I found the Python code, which is basically a close literal translation (by me) of the MATLAB code, too slow, so I generated the results using MATLAB.

Note: These results were generated with stochastic methods (namely, the training method), so my results will not agree exactly with yours, but hopefully they’ll be close enough.

Simple
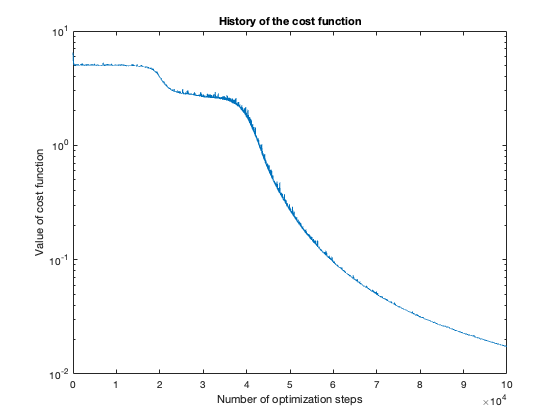
Voronoi
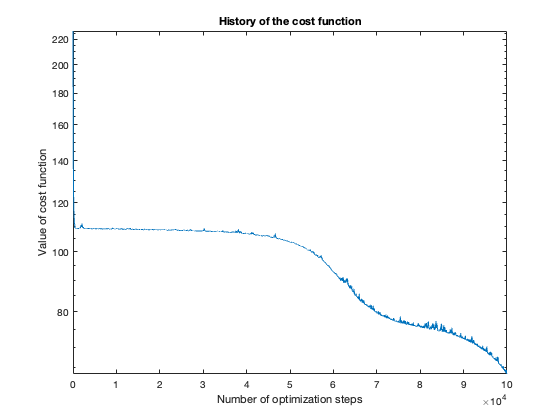
Rose

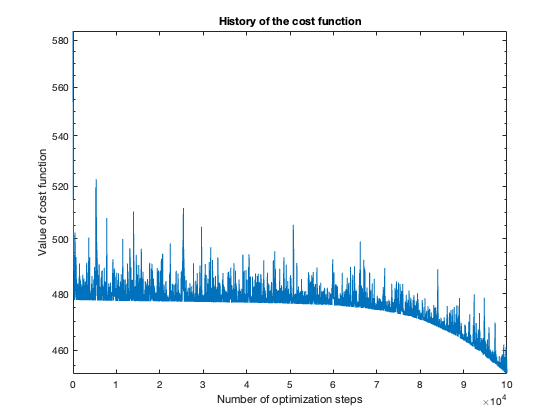
The rose problem was the most difficult to classify. Sometimes it was a complete fail. Sometimes the training method could only see one component of the rose. It worked a couple of times, namely with 20 thousand optimization steps and a random seed of 42.

I imagine this problem is difficult due to the obvious complex geometry. Specifically, the both ends of each petal become thin, which is where the testing breaks down.

Fail
Half-success
Success (mostly)
Further reading

There is just so many things to read on neural networks, particularly on the web. This post was inspired by this tutorial paper:

  • 2019 – Higham and Higham, Deep Learning: An Introduction for Applied Mathematicians.

I covered this paper in a previous post.

For a readable book, I recommend this book:

  • Goodfellow, Bengio, Courville – Deep Learning – MIT Press.


Deep Learning: An Introduction for Applied Mathematicians

When I studied neural networks during my undergraduate, they didn’t receive the attention and praise that they now enjoy, becoming synonymous with artificial intelligence (AI). Loosely inspired by the workings of the brain, these statistical models were conceived by back in the 1940s for classifying data. But then they were underwent the so-called AI winter, receiving little notice from the broader research community, except for some notable exceptions.

But now neural networks are back with gusto under the term deep learning.

(Strictly speaking, the term deep learning refers to several classes of statistical or machine learning algorithms with multiple layers making them deep, and neural networks is one class of these algorithms.)

To an outsider, which is most of the world, the term deep learning sounds perhaps a bit mysterious. What’s deep about them?

To dispel the mystery and shed light on these now ubiquitous statistical models, Catherine F. Higham and Desmond J. Higham wrote the tutorial:

  • 2019 – Higham and Higham, Deep Learning: An Introduction for Applied Mathematicians.

Here’s my take on the paper.

Recommended

I recommend this paper if you want understand the basics of deep learning. It looks at a simple feedforward (neural) network, which is also called a multilayer perceptron, but the paper uses neither term. Taking a step beyond simple linear regression, this is the original nonlinear neural network without any complications that they now possess.

The toy example of a neural network in the paper serves as an excellent starting point for, um, learning deep learning.

What the paper covers

When building up a neural network, a so-called activation function is needed. The working of the neural network involves this function being typically applied again and again (and again) to matrices.

The paper goes through the essential (for training neural networks) procedure of backpropagation, showing that it’s a clever, compact way based on the chain rule in calculus for getting the derivatives of this model. These derivatives are then used in the gradient-based optimization method for fitting the model. (Optimizing functions and fitting statistical models often results imply the same thing.)

Obviously written for (applied) mathematicians, the paper attempts to clarify some of the confusing terms, which have arisen because much of AI and machine learning in general have been developed by computer scientists. For example, what is called a cost function or loss function in the machine learning community is often called an objective function.

Other examples spring to mind. What is commonly called the sigmoid function may be better known as the logistic function. And what is linear in machine learning land is often actually affine.

Worked example with code

The paper includes a worked example with code (in MATLAB) of a simple 4-layer feedforward network (or  perceptron). This model is then fitted or trained using a simple stochastic gradient descent method, hence the need for derivatives. For training, the so-called cost function or loss function is a root-square function, but now most neural networks use cost functions based on maximum likelihoods. For the activation function, the papers uses the sigmoid function, but often practitioners use the recitified linear unit (ReLU) activation function is often used.

The problem is a simple binary classification problem, identifying in which of the two regions points lie in a two-dimensional square.

In the code, the neural network is hard coded, so if you want to modify the structure of the network, you’ll have to work a bit. Such coding practices are usually frowned upon, but the authors have done so for brevity and clarity purposes.

The rest of the paper

The next section of the paper involves using a pre-written MATLAB library (but not an official one) that applies a convolution neural network. (The word convolution is used, but the neural networks actually hinge upon filters.) These networks are become essential for treating image data, being now found on (smart)phones and computers for identifying contents of photos. There is less to gain here in terms of intuition on how neural networks work.

The last section of the paper details what the authors didn’t cover, which includes regularization methods (to prevent overfitting) and why the steepest descent method works, despite it being advised against outside of this field.

Code one up yourself

If you want to learning how these networks work, I would strongly suggest coding up one yourself, preferably first without looking at the code given by Higham and Higham.

Of course if you want to develop a good, functioning neural network, you wouldn’t use the code found in the tutorial, which is just for educational purposes. There are libraries such as TensorFlow or (Py)Torch.

Further reading

There is just too much literature, especially on the internet, covering this topic. For a good mix of words and equations, I recommend this book:

  • Goodfellow, Bengio, Courville – Deep Learning – MIT Press.

As I said, the book is recent, being published in 2016. It’s a fast (too fast?) moving field, but this text gets you up to speed with the main research topics in neural learning — sorry — deep learning.

Determinantal thinning of point processes with network learning applications

My colleague and I uploaded a manuscript:

  • Błaszczyszyn and Keeler, Determinantal thinning of point processes with network learning applications.

https://arxiv.org/abs/1810.08672

Details

The paper uses a (relatively) new model framework in machine learning.  This framework is based on a special type of point process called a determinantal point process, which is also called a fermion point process. (This particle model draw inspiration from the form of the wave function in quantum mechanics.) Kulesza and Taskar introduced and developed the framework for using determinantal point processes for machine learning models.

The paper covers a type of generative machine learning (or Gen AI) model, due to its using randomness to create network outcomes. In fact, you can interpret these point processes as a special Gibbsian point processes, which have at their core a Hamiltonian function. A Hamiltonian is generalized type of energy function, which is also the basis for other generative (or stochastic) models such as Boltzmann machines.

The training method for determinantal point processes is based on the maximum likelihood approach, which gives a convex optimization problem, allowing you to tackle it with your favourite gradient method, such as the BFGS or Adam method.

It turns out that point processes are amenable for looking at the signal-to-inference-plus-noise ratio (SINR) — see this post for details. More specifically, we found these point processes give tractable SINR-based expressions when you use (what I call) the standard (SINR) model, which I covered in a previous post.

Code

The MATLAB code for the producing the results in the paper can be found here:

https://github.com/hpaulkeeler/DetPoisson_MATLAB

I also re-wrote (or translated) the MATLAB code into Python:

https://github.com/hpaulkeeler/DetPoisson_Python

Further reading

My collaborators and I later extended this line of work in a separate paper, where we looked at the problem of designing a smart(er) medium access control (MAC) scheduling algorithm:

  • Błaszczyszyn, Brochard, and Keeler, Coverage probability in wireless networks with determinantal scheduling.

https://arxiv.org/abs/2006.05038

I wrote about this work briefly in a later post.

Parallel (or orthogonal, perhaps) to our work, is this paper:

  • 2019 – Saha and Dhillon – Machine Learning meets Stochastic Geometry: Determinantal Subset Selection for Wireless Networks.

https://arxiv.org/abs/1905.00504

Update: A manuscript extending the above line of research by Saha and Dhillon was recently uploaded:

  • 2025 – Tu, Saha and Dhillon – Determinantal Learning for Subset Selection in Wireless Networks.

https://arxiv.org/abs/2503.03151